-12345 header values after seg2 to sac conversion

Hello,

I'm trying to convert some seg2 files to sac. After conversion, the values for the AttribDict value of 'sac' are all -12345. We need at least to have the channel number in the SAC header. Any idea what's going on?

In [30]: myfile.traces[0].stats
Out[30]: Stats({'network': '', 'sac': AttribDict({'dist': 0.0, 'isynth': -12345, 'depmin': -3243.022345 ', 'kuser2': '-12345 ', 'gcarc': -12345.0, 'iinst': -12345, 'ymaximum': -12345.0, 'kevnm': 'imagsrc': -12345, 'norid': -12345, 'unused11': -12345.0, 'unused10': -12345.0, 'lpspol': 1, 'unused345.0, 't6': -12345.0, 't7': -12345.0, 't4': -12345.0, 't5': -12345.0, 't2': -12345.0, 't3': -12345, 'baz': -12345.0, 'yminimum': -12345.0, 'evla': 0.0, 'xminimum': -12345.0, 'idep': -12345, 'stdp':12345, 'ievtype': -12345, 'stel': -12345.0, 'depmax': 32163.488, 'lovrok': 1, 'imagtyp': -12345, 'k.0, 'cmpaz': 0.0, 'lcalda': 0, 'kt8': '-12345 ', 'kt9': '-12345 ', 'nvhdr': 6, 'kt4': '-12345 ',5 ', 'kt0': '-12345 ', 'kt1': '-12345 ', 'kt2': '-12345 ', 'kt3': '-12345 ', 'unused7': -12345d8': -12345.0, 'iztype': 9, 'kf': '-12345 ', 'b': 0.0, 'stla': -12345.0, 'f': -12345.0, 'stlo': -1: -12345.0, 'user4': -12345.0, 'user5': -12345.0, 'user2': -12345.0, 'user3': -12345.0, 'user0': -1': -12345.0, 'az': -12345.0, 'nevid': -12345, 'depmen': 29.22197, 'mag': -12345.0, 'kdatrd': '-12340274658203, 'odelta': -12345.0, 'ko': '-12345 '}), '_format': 'SAC', 'sampling_rate': 1999.9998779UTCDateTime(2014, 2, 12, 0, 46, 14), 'delta': 0.00050000003051758, 'calib': 4.2703999e-05, 'npts': , 499502), 'channel': ''})

Thanks,
Aaron
Hello again,

Is it possible to splice two traces into one? I have 30 second seg2 input files and want to produce long sac output files.

Thanks,
Aaron

Hi Aaron,

how does the subject line relate to your question?
I do not find the related thread.

Anyway, -12345 is a the value for some header field which is undefined. So probably either the respective value is not available in your original file or the converter simply does not set it. If you have a way to determine the value you can set it in your code.

To merge to traces you could add them:
http://docs.obspy.org/packages/autogen/obspy.core.trace.Trace.html#obspy.core.trace.Trace

If you have these traces in an Stream object and ID correspond you could use the merge method:
http://docs.obspy.org/packages/autogen/obspy.core.stream.Stream.merge.html#obspy.core.stream.Stream.merge

Refer to the manual for further details.

Regards,
~petr

I guess I partly replied in my last mail.
However, I do not completely understand what you are trying to do. Are you using some extern converter?

It looks like you read SAC with ObsPy. I do not know the SEG2 format well, but maybe you want to try reading the the SEG2 file directly into ObsPy, manipulate it and write it back in SAC format (or any other format)?

Have a look here:
http://docs.obspy.org/packages/obspy.seg2.html

You can use the generic obspy.read() method from core …

Hope that helps!
~petr

Hi Petr,

I read in seg2 .dat files using obspy.read(), and then was trying to write them to sac using mystream.write('myfile', format='SAC'). I guess that the headers aren't mapping well and the channel information is not coming through.

Thanks,
Aaron

Aaron,

it is quite usual to keep the discussion on the list so that other users (or contributors) are informed as well, so I CC the list again.

Well, I would need to see the header/stats. But for what you are writing/copying it looks like your traces are not continues and probably this is the reason there are actually two traces you end up with. If there is a gap (or another issue/overlap?), a masked array (see NumPy for details on this) is created. The invalid part is masked. The obspy.sac module seems not to have support for this, which is reasonable.

You need to decide what to do about this not valid part, and "repair" it (e.g. fill with some zero or some other value). Once you have a continues trace, you should be able to write it in SAC format as well.

Good luck!
~petr

Hi all,

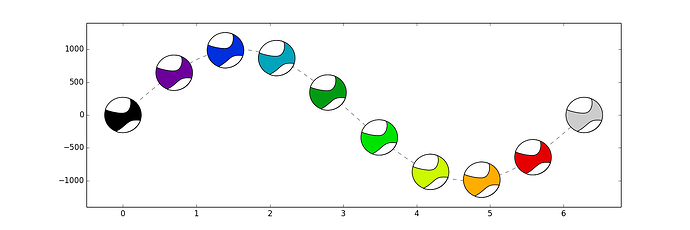
I'm trying to plot some beachballs on plot (not map), actually something like the below:
http://matplotlib.org/examples/pylab_examples/marker_path.html
but instead of markers, imagine beachballs.

For some reason the beachballs are view vertically stretched, something like ellipses, and not circles.
Any suggestions?

Thank you in advance,
Nikos

Hi Nikos,

have a look at this example in our gallery:

http://docs.obspy.org/tutorial/code_snippets/basemap_plot_with_beachballs.html

Cheers!

Lion

Hi Lion,
Thank you for your answer. However, I don't have problem on plotting beachballs on maps, but on plots containing a function.
I want to create something similar to this: http://bbnet.gein.noa.gr/mt_solution/2014/140209_08_22_58.59/140209_08_22_58.59_inv1.png
N.

Nikos,

Try using pyplot.axis(‘scaled’) before plotting. This maintains the aspect ratio between the x-y axis.

Leo

If that is not an option (different value ranges on x/y), I just
checked, for Beach
(http://docs.obspy.org/packages/autogen/obspy.imaging.beachball.Beach.html#obspy.imaging.beachball.Beach)
you can actually provide the "width" parameter as a tuple, so you can
make an ellipsoid patch that shows up as a circle on a non-equally
scaled plot.
Also see source:
https://github.com/obspy/obspy/blob/b79967d0c125774e20d95aaa0ac06c0db9d58756/obspy/imaging/beachball.py#L83-L87

(Unfortunately this possibility has not been covered in the docstring at
the time..)

If you come up with a nice plot of a non-equally scaled x/y function
plot with beachballs in it, please share the code with us, so we can
include it in the tutorial! :slight_smile:

best,
Tobias

Hi Leo,
Thank you for your answer.

Take a look at the attachments:

1.png is without pyplot.axis('scaled')
2.png is with it
At the first image the beachballs are vertically stretched and at the second the y-axis is getting very small to "fit" the beachballs.

N.

1.png

2.png

Just a short comment:
If the channel code is present in the original SEG2 file, but not in an
output SAC file, that means we didn't read it correctly from the
original SEG2 file. You can simply check by printing the Stream info
after reading from SAC.

All the special metadata fields in SEG2/SAC you would have to map
manually, there is no general way for us to do this with all the
different waveform file formats out there.
Also please check this earlier post about pitfalls with waveform file
format-specific metadata:
http://lists.swapbytes.de/archives/obspy-users/2013-September/000978.html

best,
Tobias

OK, so it’s as Tobias wrote.

Tobias, might be worth investigating how matplotlib symbols don’t suffer from this (circles, triangles, etc). Maybe they have a special property or are defined using figure coordinates ([0-1]) instead of real coordinates.

Leo

Yes, I didn't try but something like.. (inside Beach source code)

matplotlib.patches.Ellipse(..., transform=ax.transAxes)

could do the job to scale the width with respect to axes coordinates
(instead of data coordinates). But.. I wonder if it is possible to use
data coordinates for placement (xy) and at the same time axes
coordinates for size/shape (width/height)..

If you investigate and come up with something nice.. let us know.

best,
Tobias

The cleanest solution would probably be as Tobias said, but I could not get it to work in a quick test… I probably did something wrong.

Anyway…attached is an example that manually calculates the correct width and height. Have fun.

The matplotlib patches also suffer from this. The markers do not.

Cheers!

Lion

beachball_rainbow.py (896 Bytes)

figure_1.png

Calculating the proper width-height looks like an easier solution. And probably doesn’t break basemap plots.

The only problem is that it breaks once the plot is resized. So one has to first set the limits for the plot and turn the autoscaling off. Otherwise I do not see any obvious problems.

True. So maybe it’s worth investigating a solution using axis coordinates after all.

OK, after messing with some matplotlib internals, I got a dirt hack to work (attached). I thought of implementing this directly on Beach but that won’t work because I need ax.transData (which Beach doesn’t have access to). So I thought of 2 options:

  1. Add an optional argument ‘ax’ to Beach and do the hack if it’s provided

  2. Add a function to the beachball module that takes the axes and Beach instance and does the hack, then returns the fixed Beach instance (something like ‘ax.add_collection(keep_aspect(ax, b))’ )

I’m more inclined toward the second option. Which do you prefer?

Let me know and I’ll make a PR with the patch.
Or if you prefer I can make a PR with one of them and we can move this discussion to the PR.

Leo

dirty_hack.py (1.43 KB)