Sorry for not jumping in earlier, but I think cartopy has greater potential for this kind of application/problem + cartopy devs are amazingly responsive. In a few words : cartopy extends pyplot.axes and adds transforms. One can create a platecarree map, input lat/lon geodetic shapefile, a geostationary image overlay and output the plot as an Robinson map png.
Not sure this was the original problem, but this might help…
we already have a lot of plotting routines that accept an additional
`ax=None` keyword to optionally use the provided axes for plotting.. so
I would probably just add `ax=None` at the end of the call.
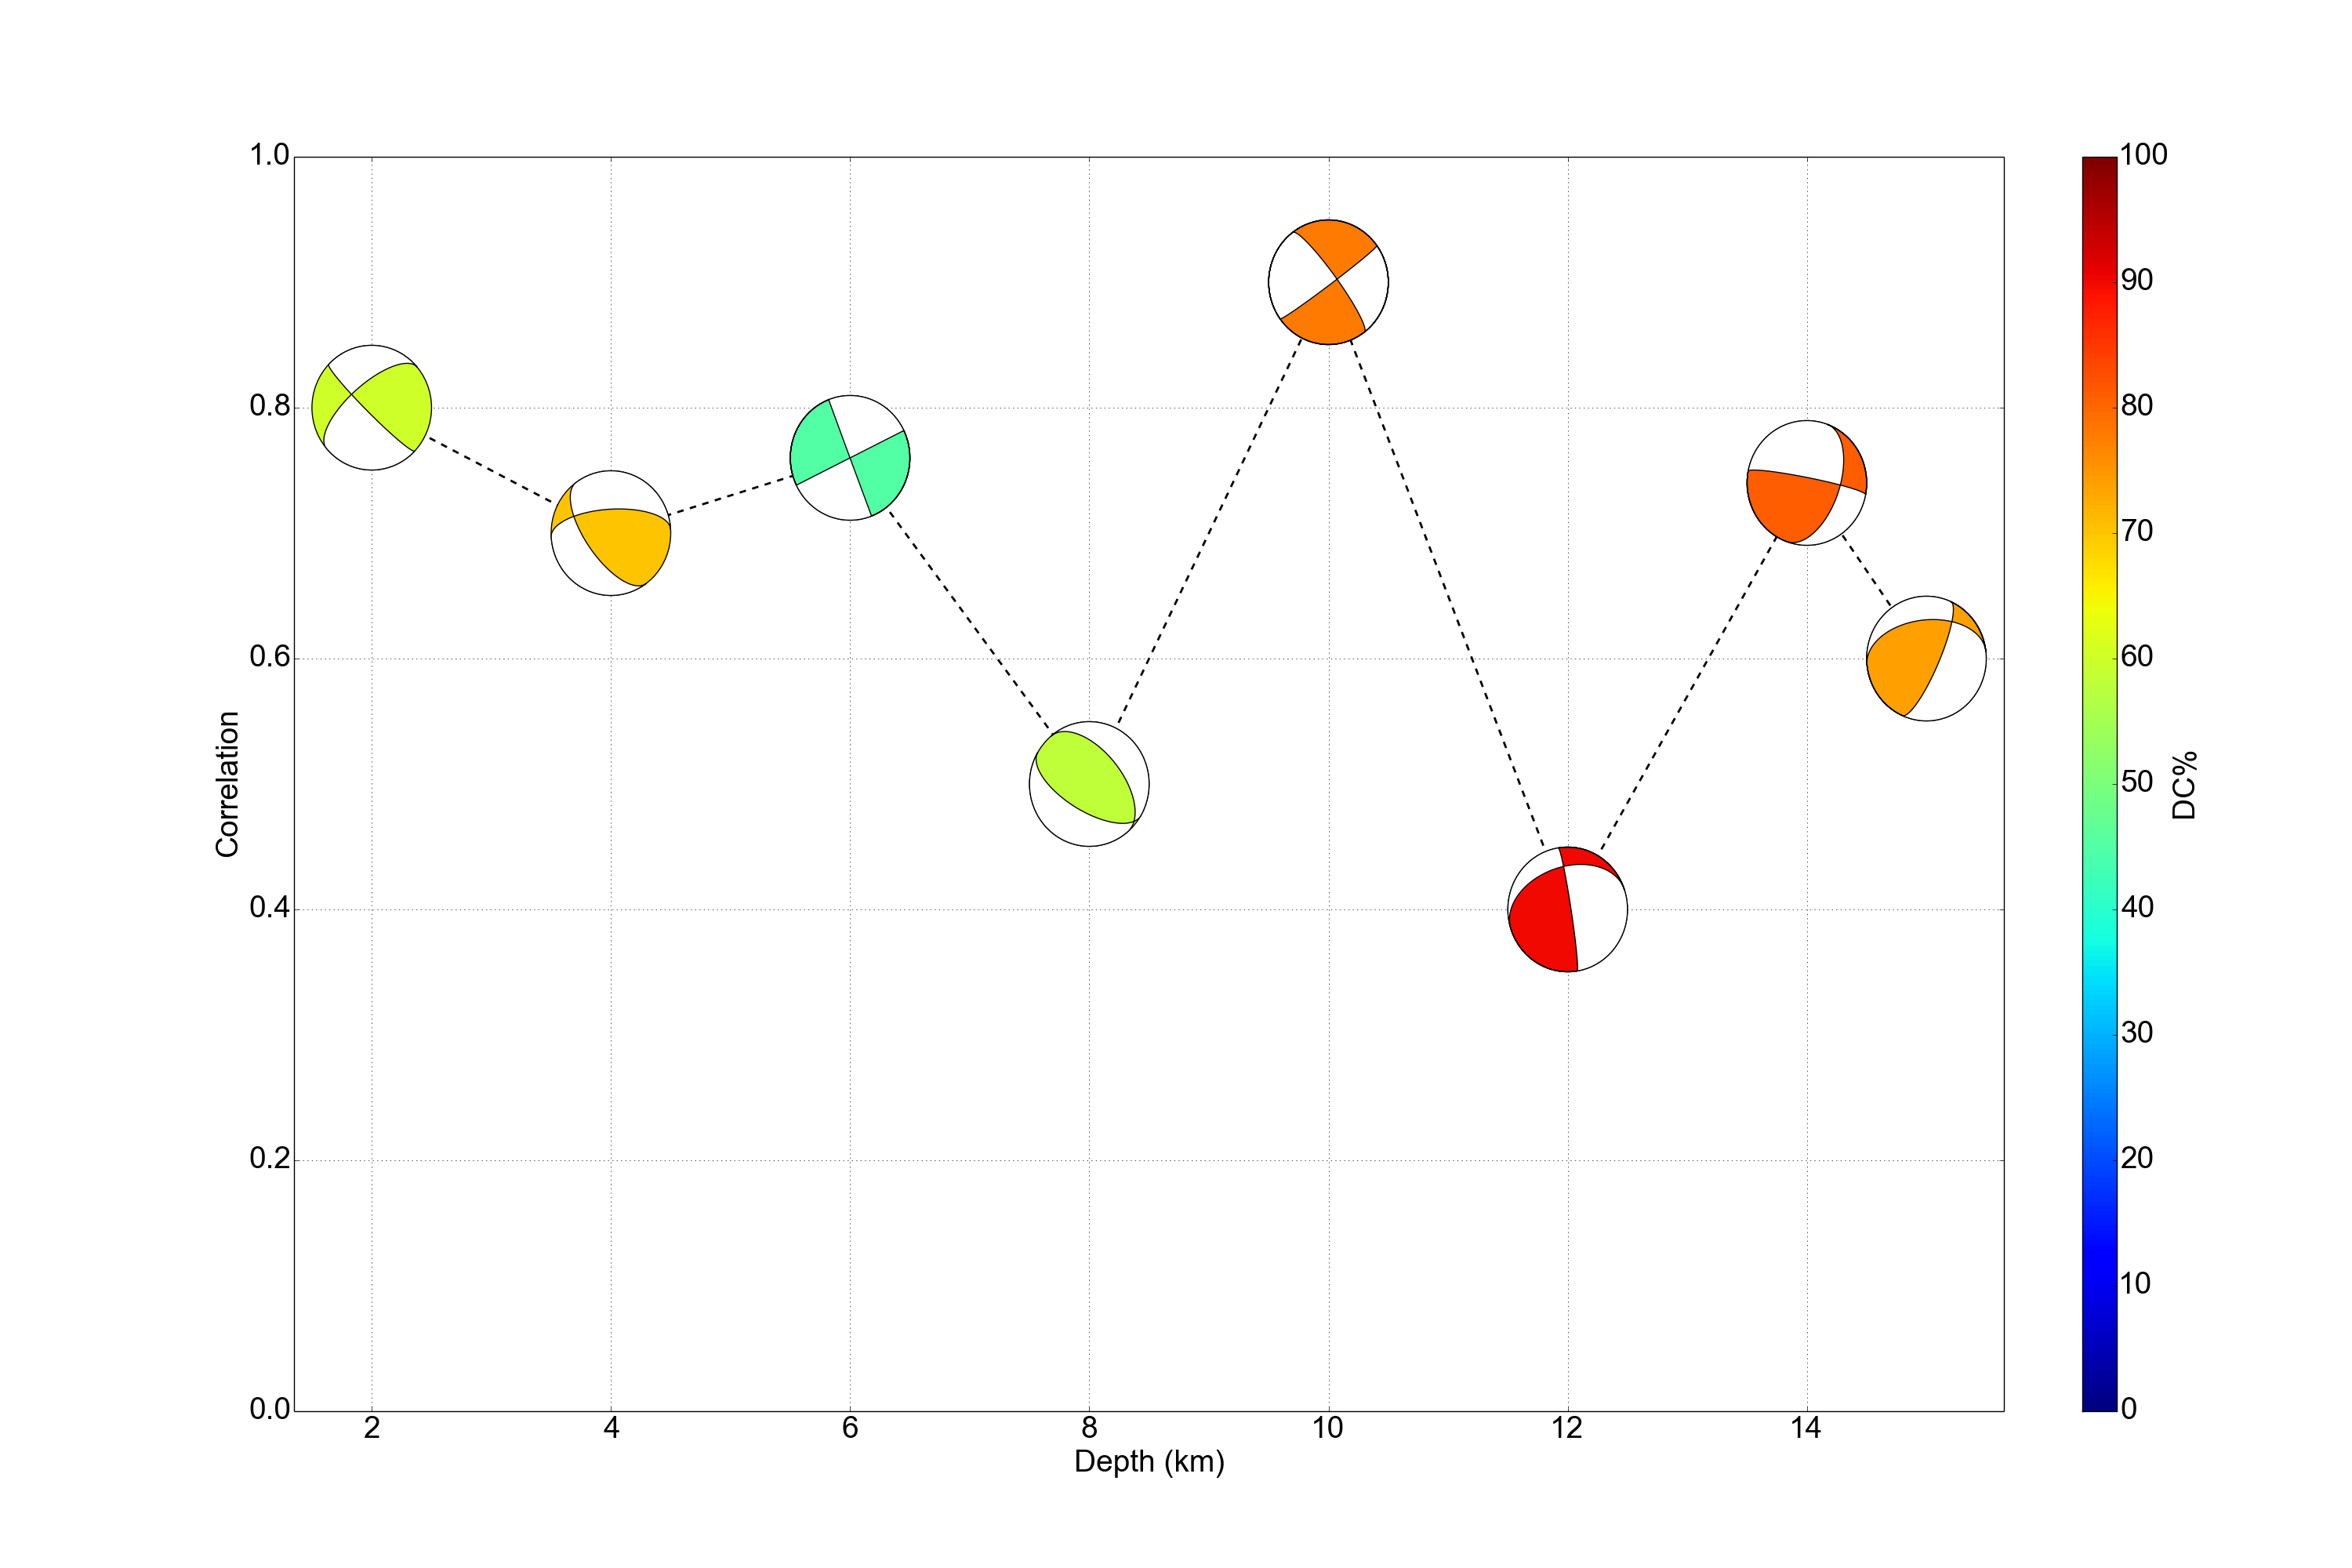
Thomas, the problem was when plotting without a basemap and ‘scaled’ axis. Does cartopy have beach ball plots? I haven’t had the chance to use it much yet.
Tobias, I’ve added the axes kwarg and submitted a PR with the changes.
Nikos, if you need this support right away you can install obspy from source from the beachball-aspect-ratio branch in my fork. After that, just add an extra argument “axes=ax” to the call to Beach and you should be set. You might need to tweak the width argument. If you don’t want to do that, then use the solution by Lion.
Hi,
Thank you all for your answers.
I finally managed to create a plot, similar to the way I want.
I'm providing an example code and its output for the obspy community.