I’m 100% new to ObsPy and sorry in advance if the question is stupid.
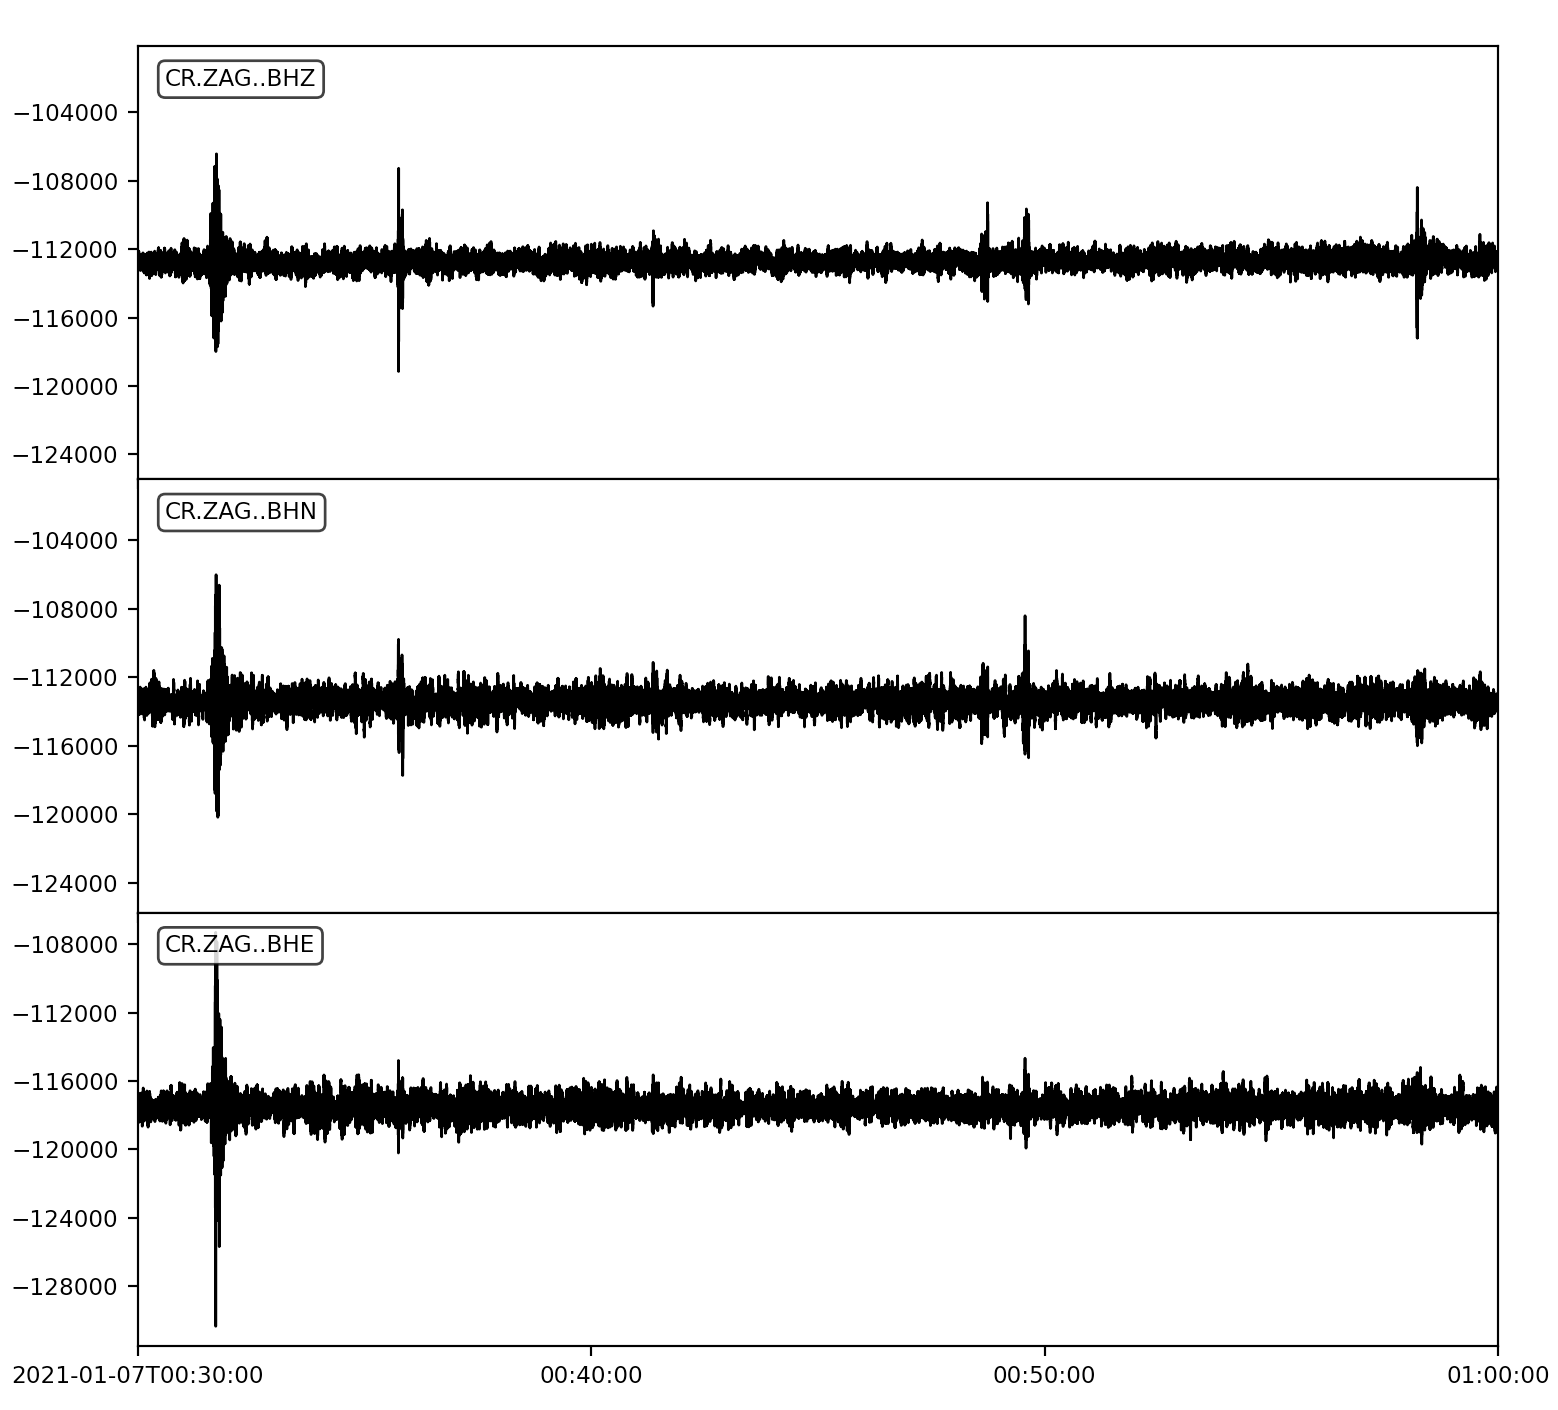
After going through tutorials, I wanted to start to get my hands on real data. So I created a client to fetch particular waveform data.
Hi Neven1986,
I similar like you were being new to ObsPy and got a similar issue. The data for the event I am interested in have very high values. You commented you forgot to remove the instrument response. Ca you explain more in detail, please?
sorry for late response… Wasn’t so much active in last time…
Once I understood from where this high numbers on y-axis come, it was easier to wrap my mind around it. Y-axis is actual seismograph “voltage” representation when movement ocurrs. In order to get graph which makes sense to us e.g. vibrations towards + and - area with 0 as reference value, we need to include seismograph response when plotting the graph.
You can think of it as sort of coefficent(s) which is/are applied to actual plotting values to get the plot starting at reference value of 0. This “response” is different among seismographs and this values need to be included when pulling waveforms, like this (mind “attach_response” in the end):
st = client.get_waveforms("CR", "ZAG", "*", "BHN", t_start, t_start+30*60, attach_response=True)
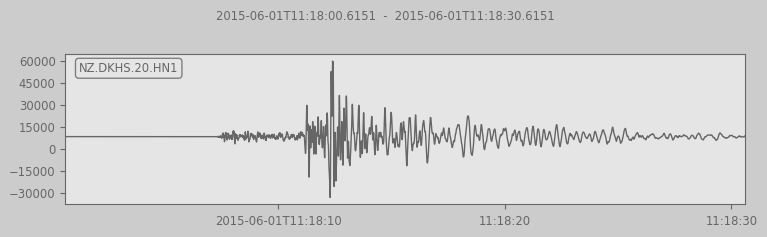
Now you have everything you need to get your desired graph. First copy your array to another array and apply “remove_response” method.