Hello obspy family
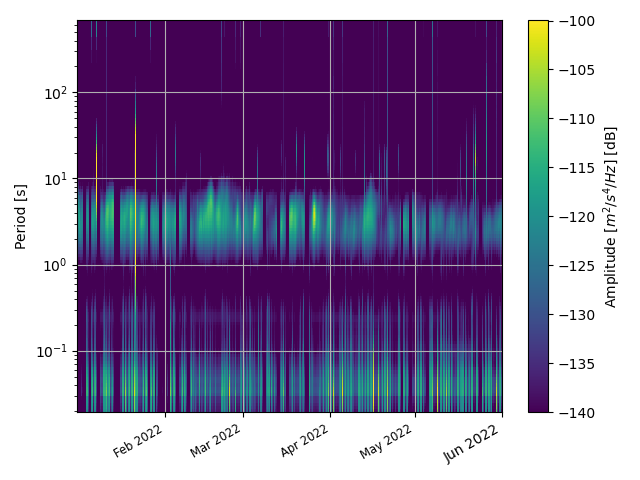
I want to see the 24-hour and monthly changes when outputting the spectrogram using ppsd as shown in the attached picture.

So I wrote the code as below and ran it
from obspy import UTCDateTime
from obspy.signal import PPSD
from obspy.core.inventory import Inventory
import matplotlib.pyplot as plt
import matplotlib.dates as mdates

# Set the start and end time of the data
starttime = UTCDateTime("2022-01-01T00:00:00")
endtime = UTCDateTime("2022-06-01T00:00:00")

# Reconstruct the PPSD object
ppsd = PPSD.load_npz("D:\\jungsun data\\site channel\\JSTB H_only\\2022_velocity\\JSTB.HHZ.2022.mmm.npz")

# start and end time (set new time range)
mask = ppsd._stack_selection(starttime=starttime, endtime=endtime)
ppsd._times_processed = [t for i, t in enumerate(ppsd._times_processed) if mask[i]]
ppsd._binned_psds = [t for i, t in enumerate(ppsd._binned_psds) if mask[i]]

# Plot the PPSD spectrogram
fig = ppsd.plot_spectrogram(clim=[-140,-100], show=False)

# Update x-axis to display months
ax = fig.axes[0] # Get the spectrogram subplot (main plot)
ax.xaxis.set_major_locator(mdates.MonthLocator()) # Set major ticks to months
ax.xaxis.set_major_formatter(mdates.DateFormatter('%b %Y')) # Set the display format for months
plt.setp(ax.xaxis.get_majorticklabels(), rotation=30, ha='right') # Rotate and align month labels

# Show the plot (if not running in Jupyter or similar environments)
plt.show()
Then, in the picture output, the time axis was simply changed to month… Does anyone know how to handle this?
Thank you in advance.