Hello,
This might be more of a signal processing and filtering question, but I’m hopeful I can find some help here.
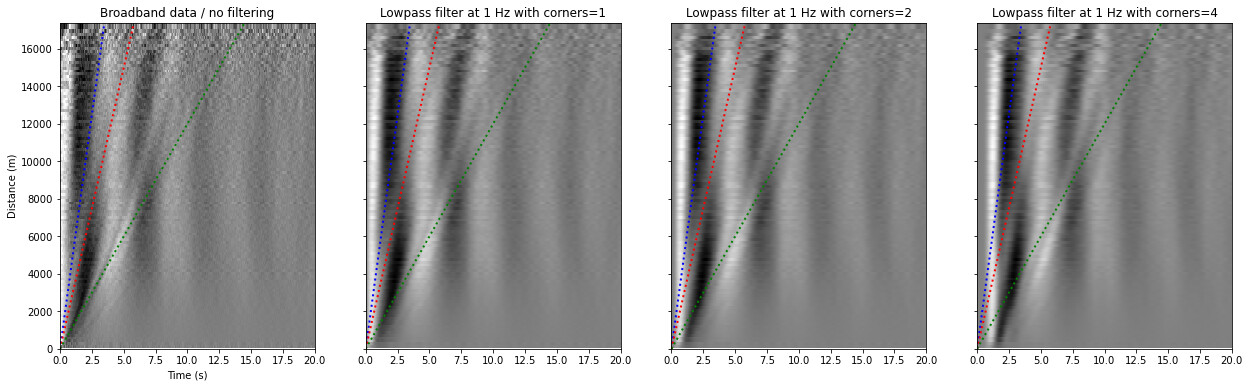
I am trying to filter a time-distance gather of ambient noise cross-correlations (binned into distance intervals aka “binned stack”). I applied the function obspy.signal.filter.lowpass() with zero-phase, but the results appear to show a shift anyway that increases with the number of corners specified. (same happens with bandpass()).
I can’t really explain myself why does this happen.
I apply the function this way:
# Input data is D, a numpy 2D array of the binned symmetric cross-correlations, with distance bin in the first dimension, and time samples in the second dimension

fig, ax = plt.subplots(1, 4, figsize=(21, 6), sharex=True, sharey=True)

ax[0].pcolormesh(tsym, distsym, D, cmap='gray', vmin=-1, vmax=1,shading='auto')
ax[0].set_title("Broadband data / no filtering")

D1 = lowpass(D.copy(), freq=1, df=25, corners=1, zerophase=True)
ax[1].pcolormesh(tsym, distsym, D1 / np.max(np.abs(D1)), cmap='gray', vmin=-1, vmax=1,shading='auto')
ax[1].set_title("Lowpass filter at 1 Hz with corners=1")

D2 = lowpass(D.copy(), freq=1, df=25, corners=2, zerophase=True)
ax[2].pcolormesh(tsym, distsym, D2 / np.max(np.abs(D2)), cmap='gray', vmin=-1, vmax=1,shading='auto')
ax[2].set_title("Lowpass filter at 1 Hz with corners=2")

D3 = lowpass(D.copy(), freq=1, df=25, corners=4, zerophase=True)
ax[3].pcolormesh(tsym, distsym, D3 / np.max(np.abs(D3)), cmap='gray', vmin=-1, vmax=1,shading='auto')
ax[3].set_title("Lowpass filter at 1 Hz with corners=4")

for curax in ax:
    curax.plot(time, time * 5000, c="b", lw=2, ls=":") # Reference line for V=5 km/s
    curax.plot(time, time * 3000, c="r", lw=2, ls=":") # Reference line for V=3 km/s
    curax.plot(time, time * 1200, c="g", lw=2, ls=":") # Reference line for V=1.5 km/s

ax[0].set_ylabel('Distance (m)')
ax[0].set_xlabel('Time (s)')
ax[0].set_xlim((0, 20))
ax[0].set_ylim((0, max(distances)))
plt.show()
plt.close()
This is the resulting plot, where one can see there is a shift to the right with increasing corners.
Would love some help understanding this. Happy to share the data if needed.