I’m new to Obspy and I’m trying to get amplitude of different phase arrivals.
I have a trace that I can plot in time domain and in spectrogram which is nice to visualize where has the highest amplitude over time, but when I use the TauPyModel , I get all the individual arrival time but not their associated amplitude, are there any methods I can use for getting them ?
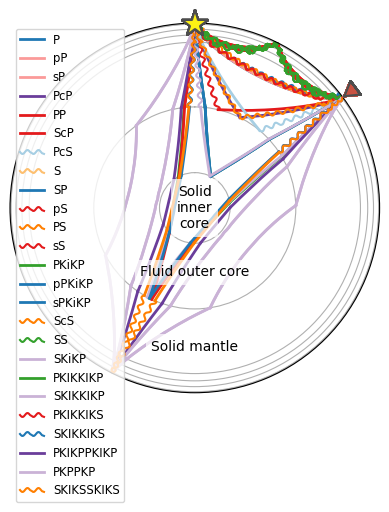
Another thing about the TauPyModel , within the model.plot_rays(indicate_wave_type=True) , the documentation mentioned
Amplitudes are not within the scope of TauP. You might need some kind of waveform modeling tool for that.
It’s hard to tell from your plot because it contains so many rays, but if you are referring to the objects in the legend being “wiggly” or not, it looks like that might simply depend on whether the last part of the ray is an S wave or not. Many of these rays have conversions in them and are partially S and partially P. It might be better to have a combined symbol half wiggly and half straight in the legend, but that would mean additional work to implement.
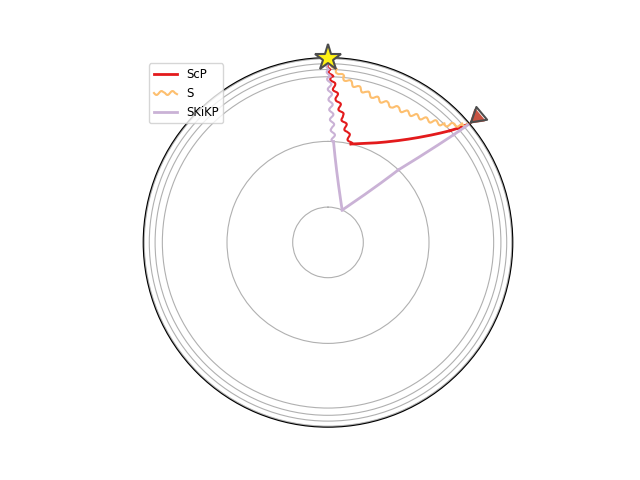
from obspy.taup import TauPyModel
model = TauPyModel(model="iasp91")
arrivals = model.get_ray_paths(source_depth_in_km=30, distance_in_degree=50, phase_list=["ScP", "SKiKP", "S"])
ax = arrivals.plot_rays(indicate_wave_type=True, legend=True)