Hi Mr. Tom Richter.
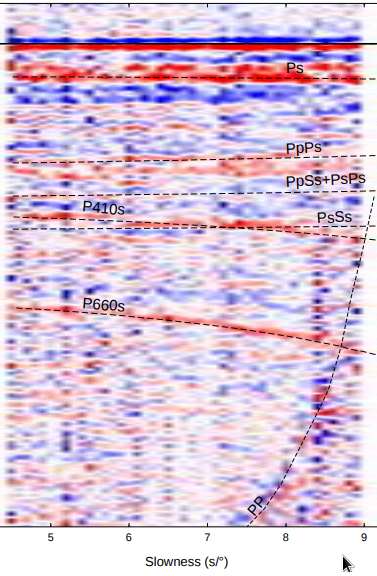
I am working with your scripts to generate stacks of RF. I want to generate a stacked section, but instead of time vs. distance, I want to plot time vs. slowness (as in the figure). Do you thing that it could be done using: get_profile_boxes(latlon, 0, slowness, width=400)?
Do you think it is feasible to do PRF and SRF with short period instruments?
Cheers!