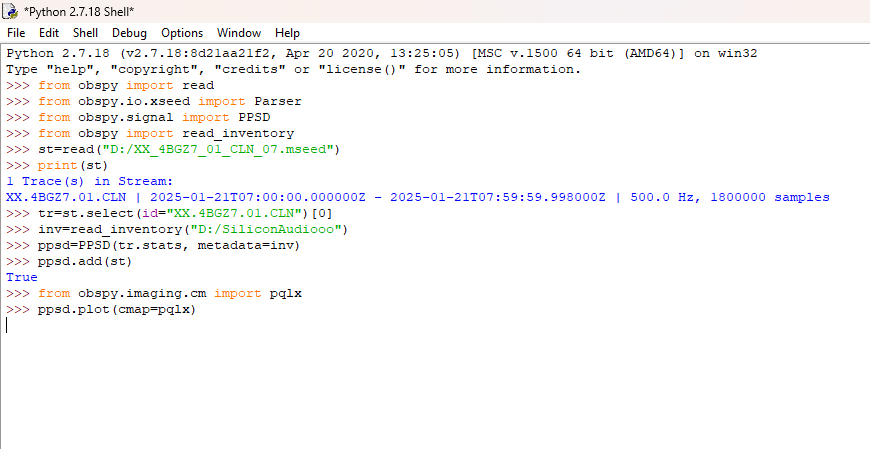
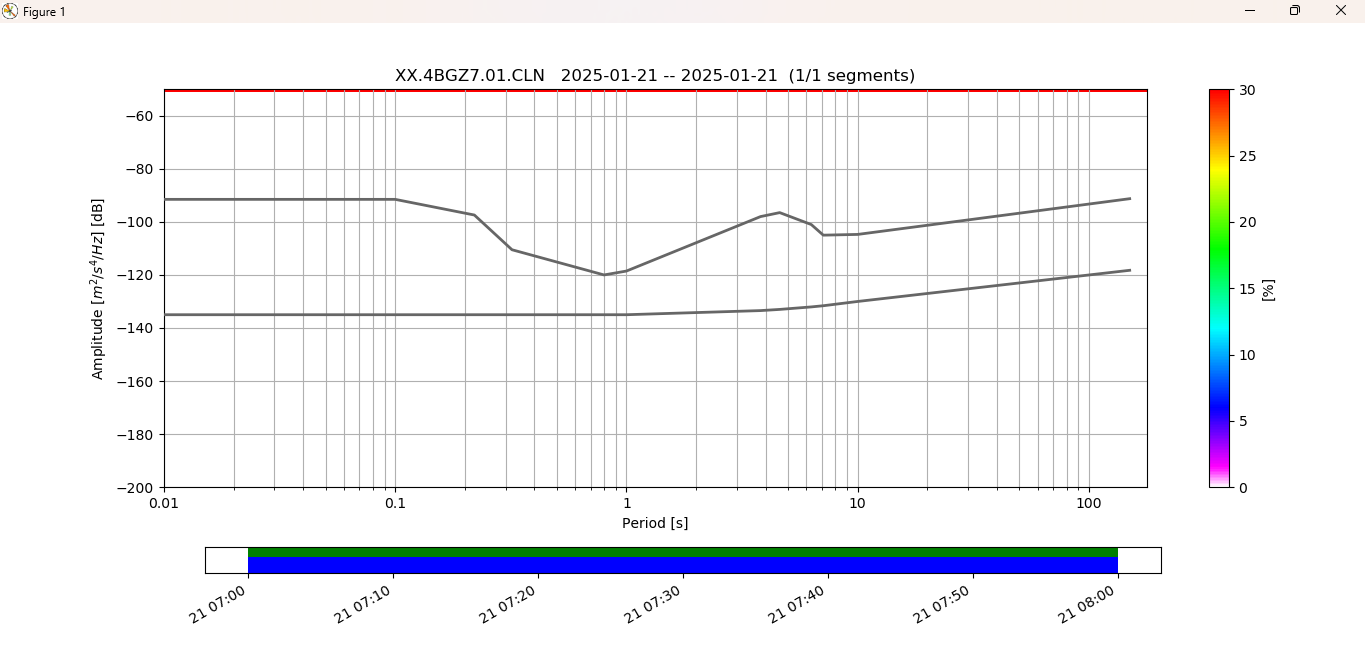
I have silicon audio sensor. I have made Dataless PDCC IRIS for silicon audio. Then, I try use obspy python for display PSD’s graphic. I also use StationXML as metadata silicon audio. But, I have problem that the PSD’s graphic can’t display well. You can see the script and result at below. Can you help me to solve this problem? What’s wrong with that? thank you
What are the two different metadata files you use there? If there is one for the sensor and one for the digitizer, you need to combine both properly and use that for response removal.
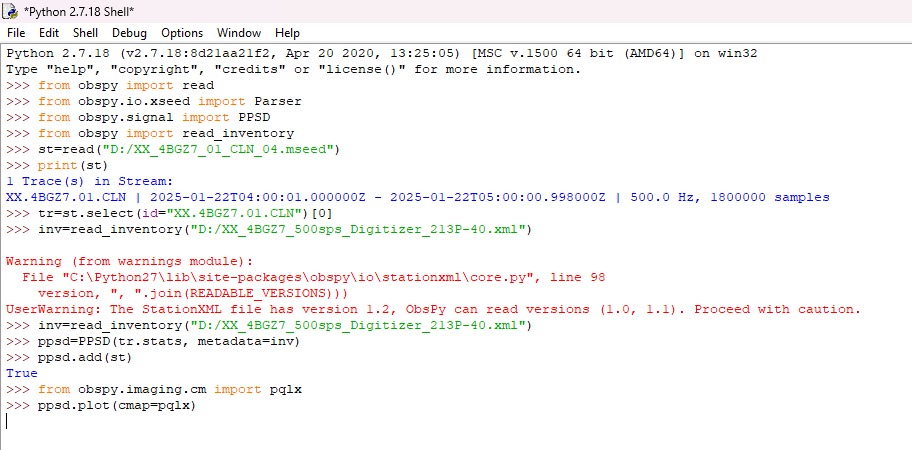
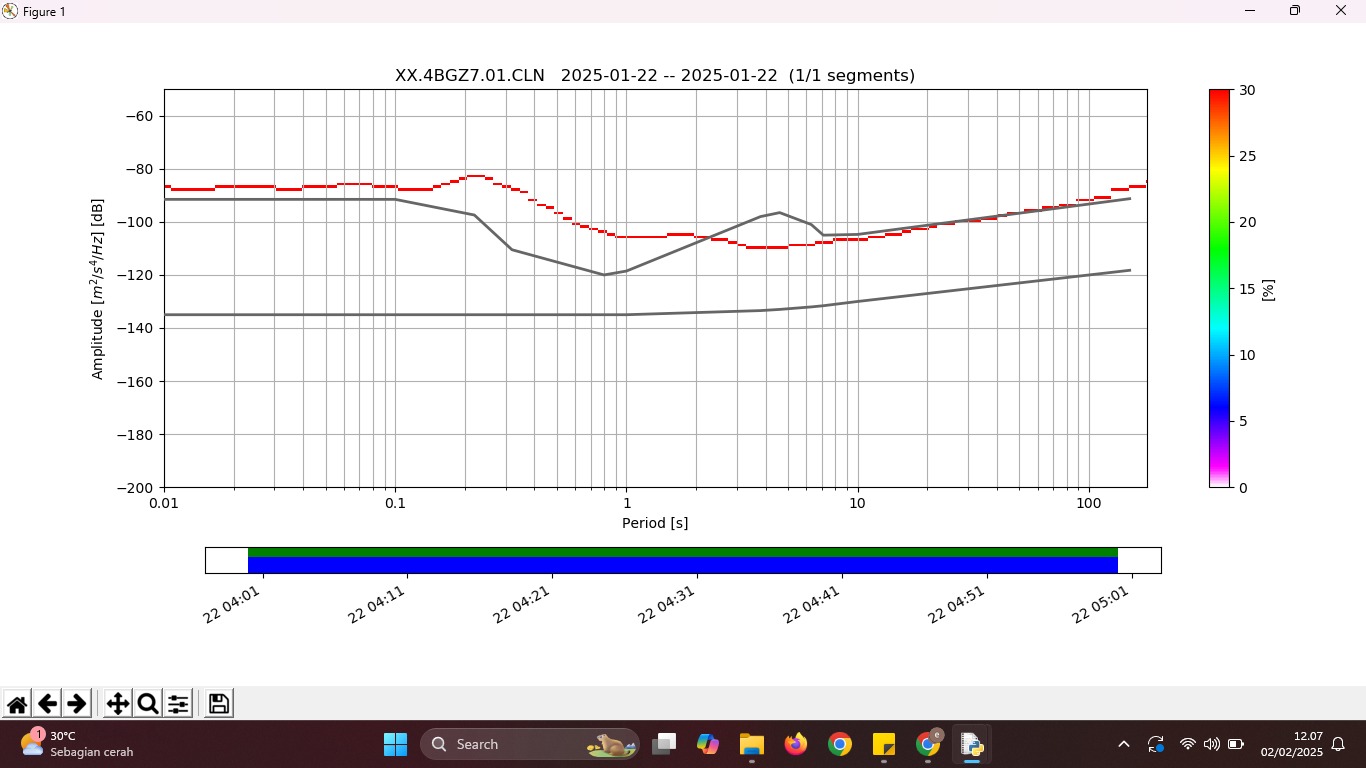
I tried use two metadata which are metadata from NRL tools and metadata StationXML. But, the results can’t display PSD grahics properly. What’s wrong with those? Can you help me? Thank you
You need to sort out the issues with the metadata. Try plotting it and confirm that the frequency response matches what you expect from the used sensor and digitizer.