Hello everyone!
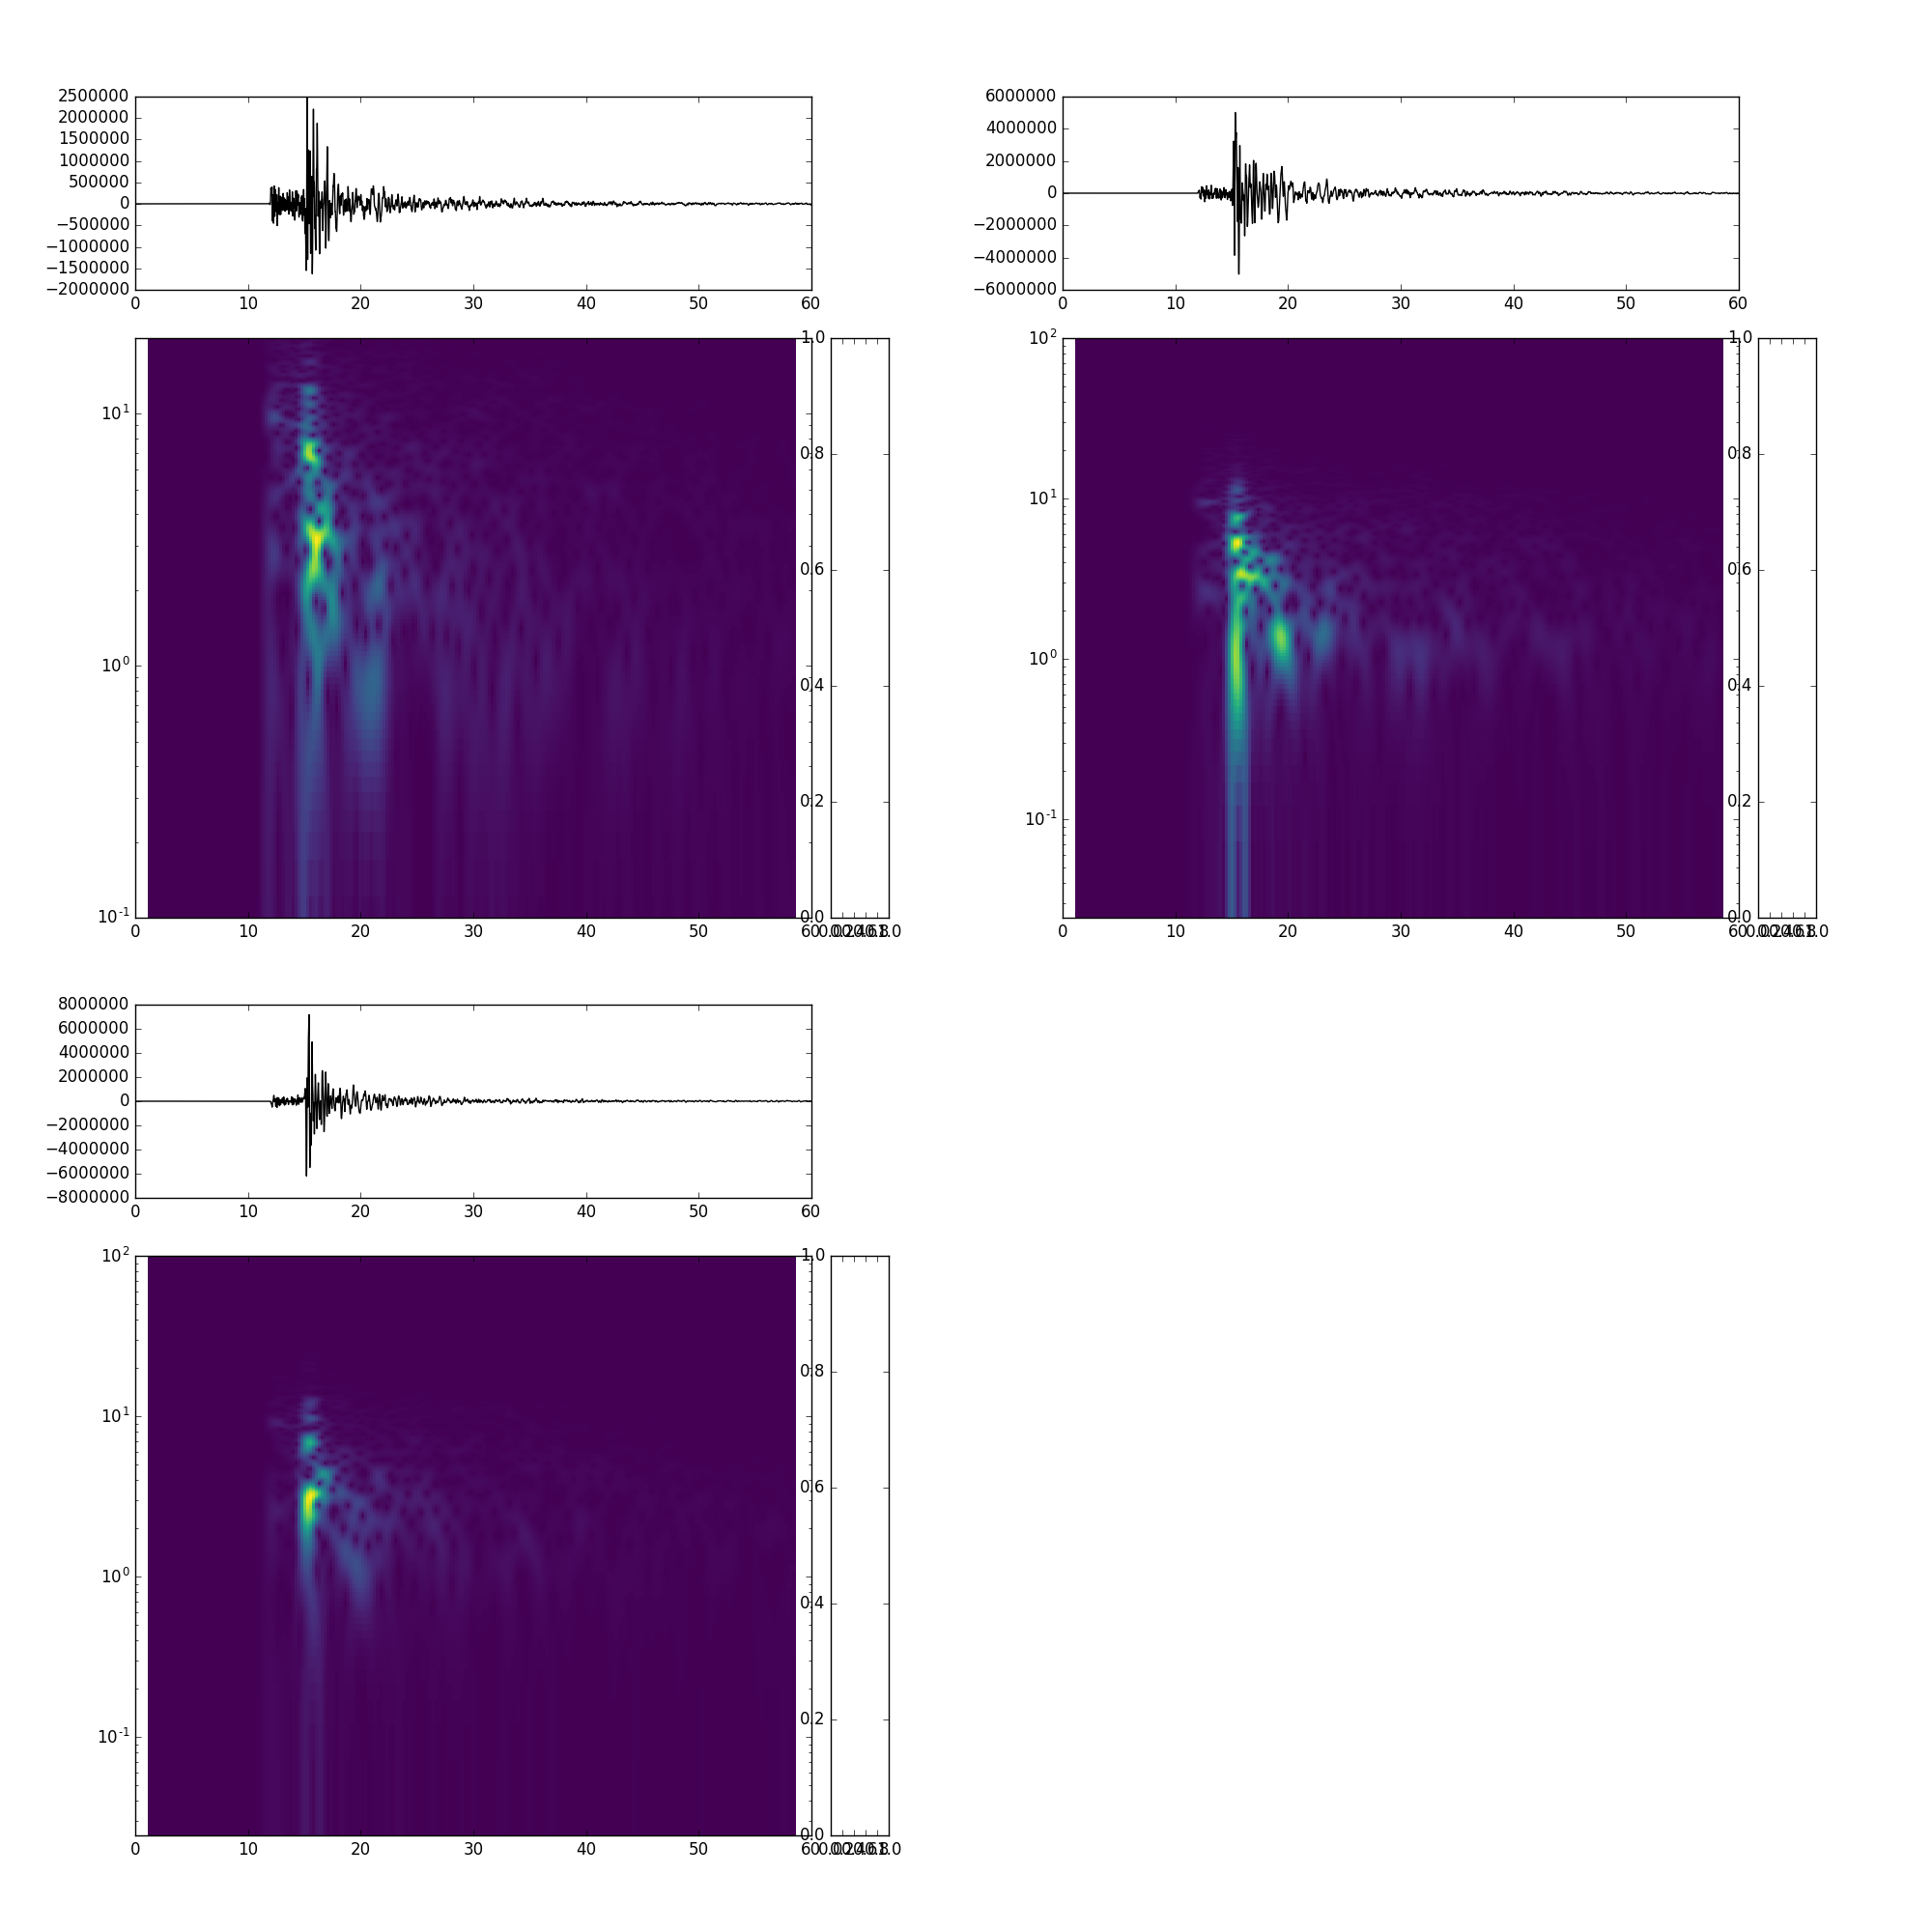
I think I am missing something in my understanding of the obspy spectrograms. As you can see in the attachement, there are vertical artifacts present on all 3 chanels, somewhere below 0.5Hz. If I plot the same data in geopsy, this noise is not present (without changing any parameters). Any advice on that?
And another thing:
I cant make the colorbar working if i set log=True. When False, it works perfect.
Thank you very much!
Blaz
Hi Blaz,
it is likely connected to the advanced settings the spectrogram function uses as defaults.
See here: https://docs.obspy.org/packages/autogen/obspy.imaging.spectrogram.spectrogram.html#obspy.imaging.spectrogram.spectrogram
Geopsy is likely to use different window length settings per default then Obspy does, hence you will see a different result at certain frequencies.
If you are interested in lower frequencies, I would assume that the sliding window length has to be larger than if you are interested in high frequencies.
There is the usual tradeoff between temporal and frequency resolution.
Default settings are unlikely to give you the best result for your problem.
Cheers
Martin