Hi,
I am curently trying to create a spectrogram of mseed data.
The spectrogram function create one spectrogram by Trace, but I would like to create a single one with all the Traces put together.
How can I concatenate all the Traces in a single one, leaving zero’s when the data are missing ?
I would also like to change the axes in order to have frequency as abscissa and time as ordinate.
Then, it would be perfect if the time axis label were in hours:minutes:seconds (with a tic every 10minutes) instead of seconds.
Thanks for all,
Antoine
Trainee at the Volcanic Observatory of the Reunion Island
Dear Antoine,
I am curently trying to create a spectrogram of mseed data. The
spectrogram function create one spectrogram by Trace, but I would
like to create a single one with all the Traces put together. How
can I concatenate all the Traces in a single one, leaving zero's
when the data are missing ?
see
be aware that only traces with the same SEED id (net.sta.loc.cha) are
merged - you may have to set them manually to merge them
I would also like to change the axes in order to have frequency as
abscissa and time as ordinate. Then, it would be perfect if the
time axis label were in hours:minutes:seconds (with a tic every
10minutes) instead of seconds.
this are very specific requests which are not covered with the current
spectrogram function - you may want to plot that manually using
matplotlib directly
Just have a look at the source of the spectrogram function via
- - its not that much code and very well documented and quiet easily
extendable.
Cheers,
Robert
- --
Dr. Robert Barsch
EGU Office Munich
Luisenstr. 37
80333 Munich
Germany
Phone: +49-89-21806549
Fax: +49-89-218017855
eMail: barsch@egu.eu
Hello everyone,
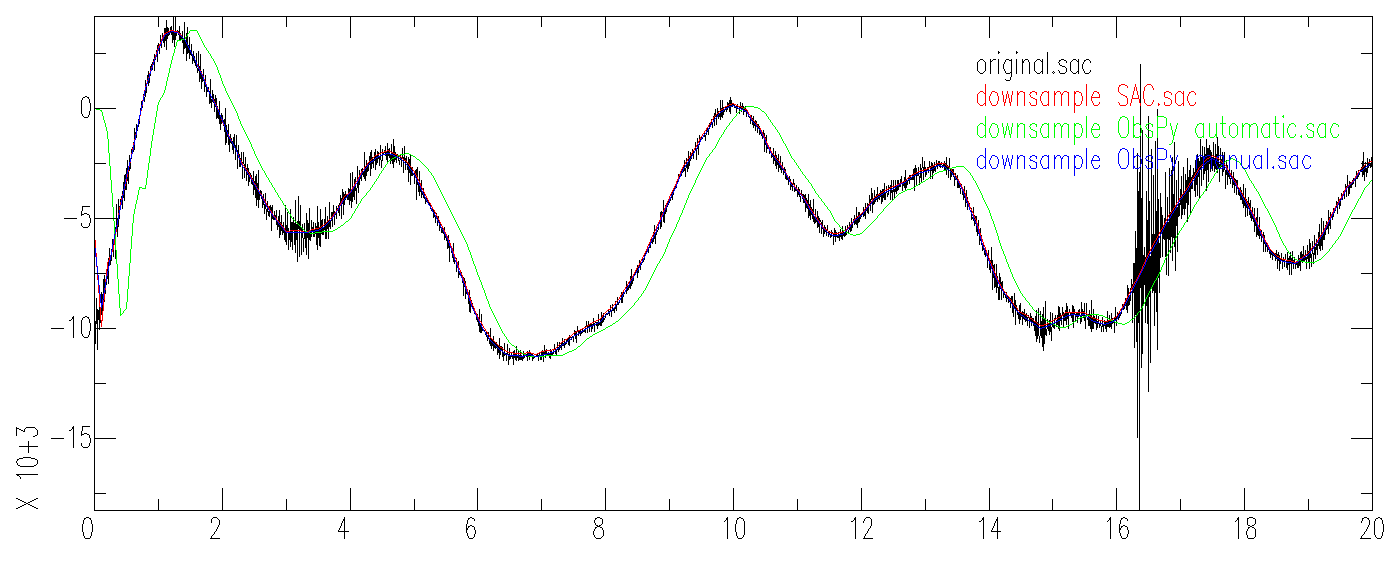
I just realized the ObsPy 'decimate' function by default adds a strong phase shift to the data, apparently using a single pass (i.e. non zero-phase) low pass filter. Using a zero-phase filter at Nyquist frequency manually before applying decimate-function (with option no_filter=True) you can avoid this and the resulting waveform is much closer to the original one. Furthermore artifacts at the beginning and end of the traces are weaker.
In the attachment you can see the original (black), SAC-decimated (red), automatically filtered Obspy decimated (green -> phase shift) and manually prefiltered, Obspy decimated (blue) traces. Original was 100 Hz data decimated by a factor of 10, lowpass filter was tr.filter('lowpass',freq=5,corners=2,zerophase=True).
Will this be changed or added in future versions of ObsPy?
Best regards,
Johannes
Hi Johannes,
thanks for pointing this issue out, I have opened a ticket to handle this..
best,
Tobias