Hi everyone, I require making a section plot for different events recorded at one station only. Here is my attempt but it gives me empty plot. May someone suggestion how can i fix this.
from matplotlib.dates import date2num


client = Client("IRIS")
T_SS=ww["S_arrival"]
T_s=ww["S_Time"]
T_SE=ww["S_end"]
T_p=ww["P_Time"]
T_O=ww["T_orgion"]
eq_latt=ww["lat"]
eq_long=ww["long"]
ev_dep=ww["depth"]
sta_lat=45.90
sta_lon=-130
ev_long=ww["long"]
ev_dep=ww["depth"]
bb=[1, 2, 3]
for a in bb:
    starttime= UTCDateTime(T_O[a])
    endtime= UTCDateTime(T_SE[a])
    eq_lat=eq_latt[a]
    eq_lon=eq_long[a]
    bulk = [('OO', 'AXCC1', '*', 'HHZ', starttime, endtime)]
    st = client.get_waveforms_bulk(bulk, attach_response= True)
    st.detrend('demean').detrend('linear').taper(0.05)
    st_bulk=st.remove_response(output="DISP")
    for tr in st_bulk:
        tr.stats.distance = gps2dist_azimuth(sta_lat, sta_lon,eq_lat, eq_lon)[0]
    st_bulk.plot(type='section')
Hi @Adnan_Seismology - would you be able to edit your code to provide working (but obviously demonstrating the lack of plot) code. At the moment it is hard to understand what the issue is based on the code you provided given that it does not run.
Hi, the key issue is my code showing output with a large time lag, whereas I am expecting the lag to be only in distance since the waveform is plotting as zero time
I imagine that might have something to do with your data’s timestamps, however it is impossible for me to check or help further without code that actually runs.
1 Like
I got your point, here is the editable script:
from obspy import Stream, UTCDateTime, Trace
from obspy.clients.fdsn import Client
from obspy.geodetics import gps2dist_azimuth

client = Client("IRIS")

time=["2015-07-10T04:12:42.200000", "2015-07-18T04:12:27.200000"]
ev_lat=[-9.3539, -10.4574  ]
ev_long=[158.3424, 165.1009]

sta_lat=45.90
sta_lon=-130

aa=[0, 1]

st_p=Stream()
for i in aa:
    starttime=UTCDateTime(time[i])
    endtime=starttime + 600
    bulk = [('OO', 'AXCC1', '*', 'HHZ', starttime, endtime)]
    st_bulk = client.get_waveforms_bulk(bulk, attach_response= True)
    st_bulk.detrend('demean').detrend('linear').taper(0.05)
    st_bulk.remove_response(output="DISP")
    for tr in st_bulk:
        tr.stats.distance = gps2dist_azimuth(sta_lat, sta_lon,ev_lat[i], ev_long[i])[0]
    st_p.append(Trace[0])  # What are you trying to do here!?
st_p.plot(type='section')
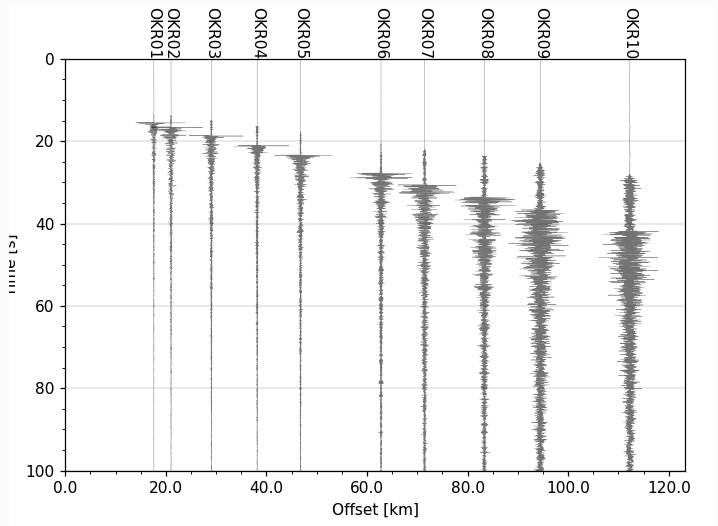
I actually want to make a section plot of different events recorded at the same station.
The expected results is attached here
this is
I edited your code to include the necessary import statements and changed a to i as you used for indexing, and changed eq_lat to ev_lat and eq_lon to ev_long. The code still doesn’t run because st_p.append(Trace[0]) errors: Trace is not subscriptable. I stopped editing there because I didn’t know what you were actually trying to do.
Please provide a working code example that shows your issue and I would be happy to help.
So I think that you meant to do something like this:
from obspy import Stream, UTCDateTime, Trace
from obspy.clients.fdsn import Client
from obspy.geodetics import gps2dist_azimuth

client = Client("IRIS")

time = ["2015-07-10T04:12:42.200000", "2015-07-18T04:12:27.200000"]
ev_lat = [-9.3539, -10.4574]
ev_long = [158.3424, 165.1009]

sta_lat = 45.90
sta_lon = -130

aa = [0, 1]

st_p = Stream()
for i in aa:
    starttime = UTCDateTime(time[i])
    endtime = starttime + 600
    bulk = [("OO", "AXCC1", "*", "HHZ", starttime, endtime)]
    st_bulk = client.get_waveforms_bulk(bulk, attach_response=True)
    st_bulk.detrend("demean").detrend("linear").taper(0.05)
    st_bulk.remove_response(output="DISP")
    for tr in st_bulk:
        tr.stats.distance = gps2dist_azimuth(sta_lat, sta_lon, ev_lat[i], ev_long[i])[0]
        # Set trace start-time to 0. This assumes that your starttime is the origin time of the event
        tr.stats.starttime = UTCDateTime(0)
        st_p.append(tr)
st_p.plot(type="section")
This is a slightly hacky way to set the time of each trace to be relative to it’s own start-time, and assumes that you have set the start-time (defined in times above) to the origin time of the earthquakes of interest.
1 Like
Thanks a lot. Yes, I am looking for this. Now, it’s easy for me to refine this.