I am trying to remove the instrument response from a mseed file after merge the data but when I plot the signal after remove the response the data is still in count. Can any help me to undestand what i am doing wrong?
This is the code I made. I am new in Python and Obspy so please be kind.
from obspy import read, read_inventory
from glob import glob
import os
import matplotlib
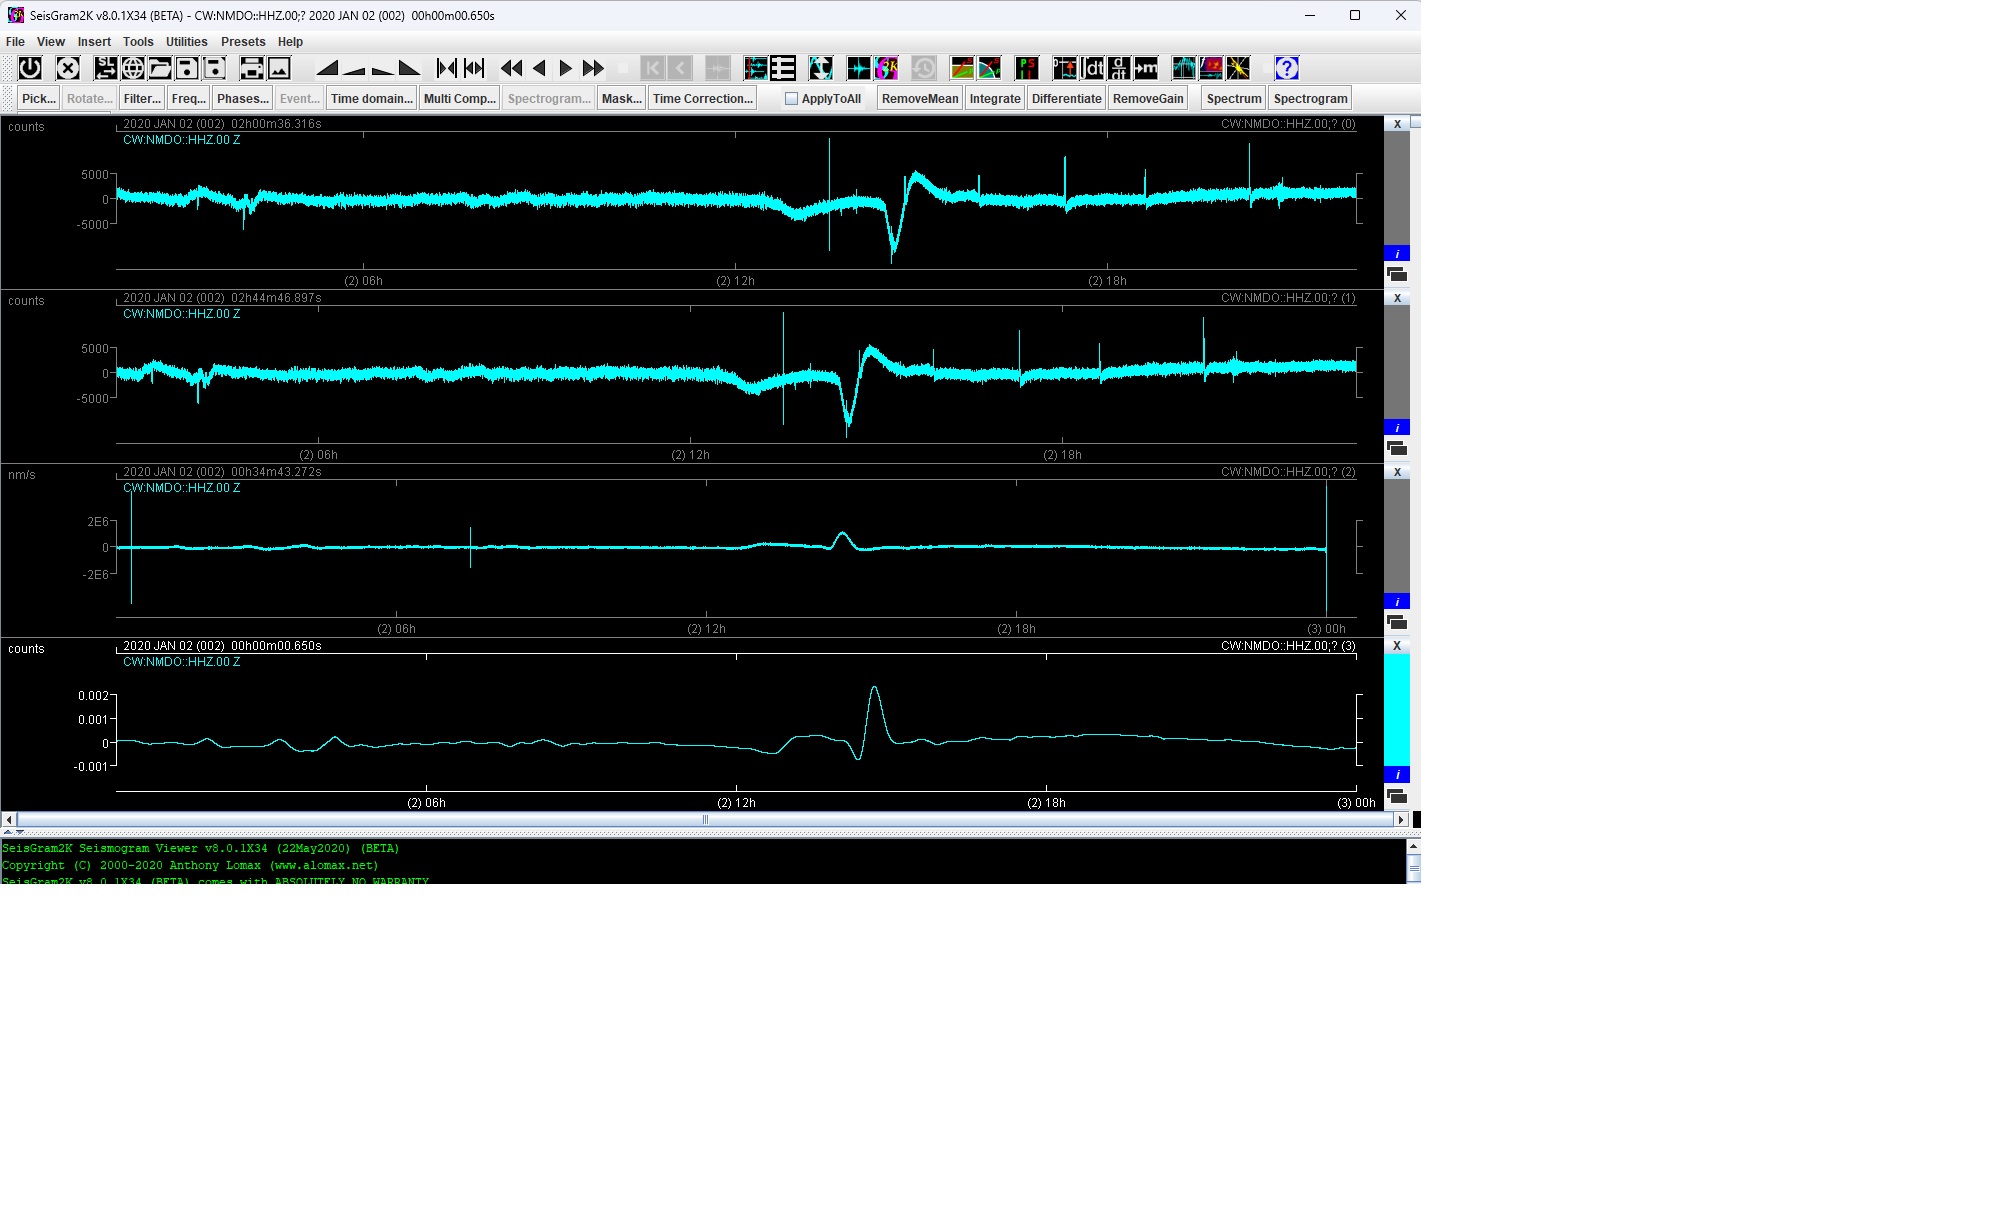
The figure shows the signal before removing the response 1(sac format), 2(mseed fromat) and signal after removing the response 3(sac format), 4(mseed format). Signal 3 is in nm/s and signal 4 in counts.
Thanks for answering. I tried what you recommend but when I plot the signal with SeisGram the amplitude is still in counts and the shape of the signal changes a bit. I compared with the same signal in sac format after correcting the response in sac and the signals are a bit different (mseed signal in count and with a low frequency component), the sac signal is in nm/s and no low frequency component.
A) When you write back your instrument corrected data, MiniSEED format has no means to indicate that the instrument response has been removed in the meantime. You need to keep track yourself what you did to the data. So when you load that data into seisgram, the program is just taking a guess what the data units are and probably just defaults to “counts” since it has no way to tell otherwise.
B) Instrument correction is not a “just do it” task. It involves multiplication with the inverse instrument response and since the instrument response for many instruments usually will go to very small values at the sides, that would mean multiplication by arbitrarily large values at low+high frequencies in many cases. So this needs to be prevented by some means of which obspy has two: a) pre bandpass filtering (which is done by tapering the signal in frequency domain), which is I believe what SAC does as well, and b) capping of the inverted instrument spectrum at a given water level. You can use either or, or a combination of the two. To better illustrate what is happening along the way I added these plots that you are seeing since you’re using remove_response(.., plot=True). It looks like the instrument correction you are doing right now in obspy is simply not preventing amplification of low frequencies as much as your SAC processing does.
Thanks for your answer, your comments are really useful. Now I understand why the low frequency component. I will try with the taper, I have to study the water level parameter. I do not have a clear idea of how this influence the results.