Hi,
I am new to learning ObsPy and to joining the ObsPy community, so let me know if I am writing this question to the wrong place. If I am, please direct me to the right place…
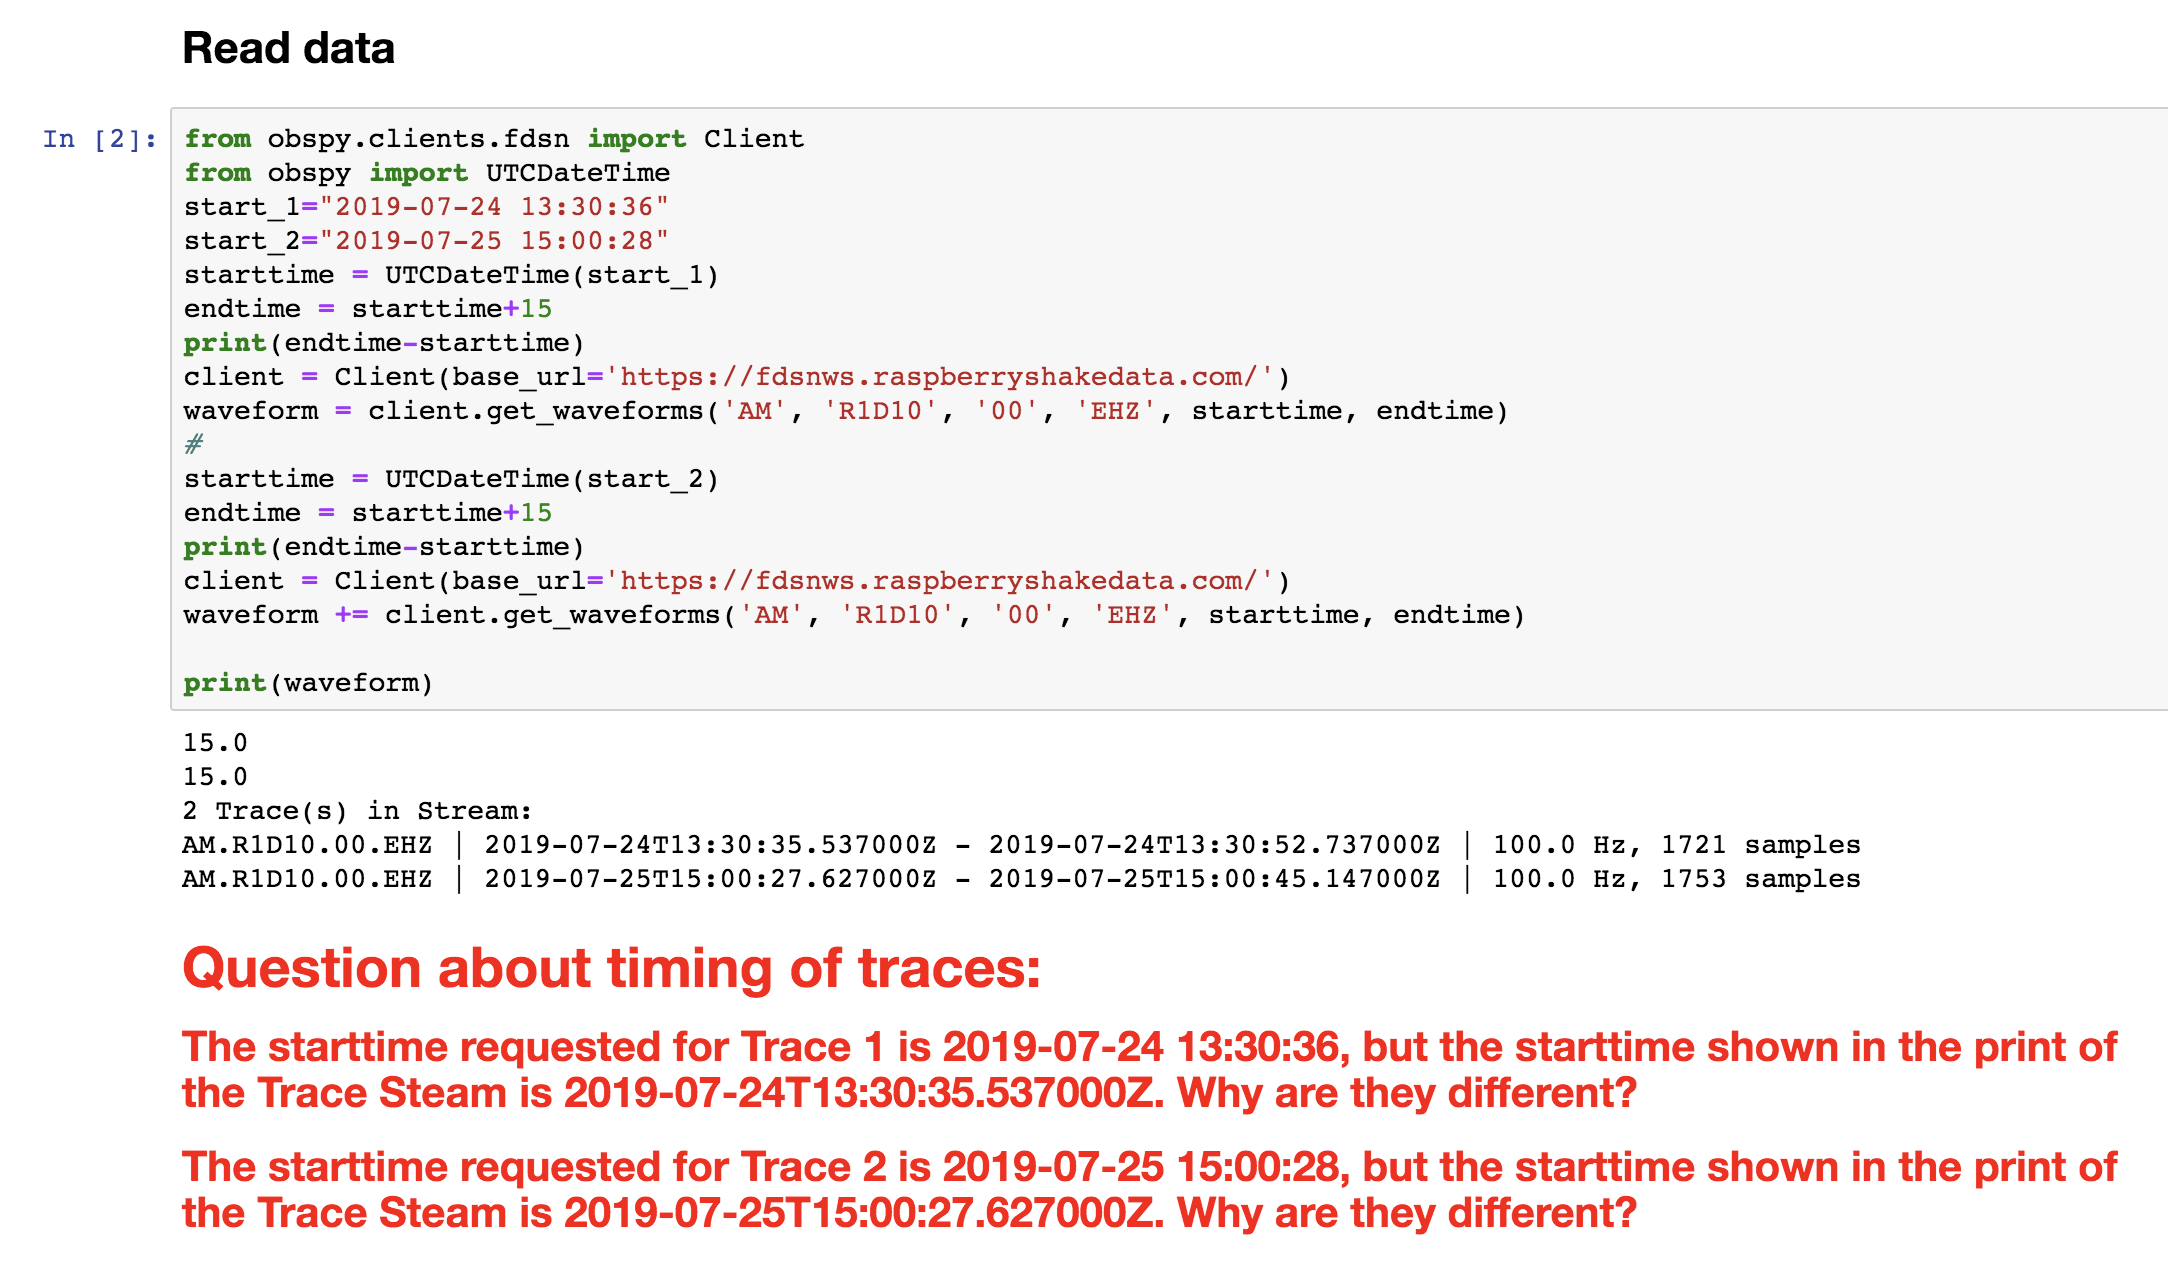
Here’s my question: I am trying to plot traces of two quarry blasts recorded by a Raspberry Shake seismograph in Vermont (see attached notebook), and plot them so that the time axis is the same for both (15 sec). But, when I try to do that, the times are not the same as what I thought I set them up to be (see attached). For example:
-
The starttime requested for Trace 1 is 2019-07-24 13:30:36, but the starttime shown in the print of the Trace Steam is 2019-07-24T13:30:35.537000Z.
-
The starttime requested for Trace 2 is 2019-07-25 15:00:28, but the starttime shown in the print of the Trace Steam is 2019-07-25T15:00:27.627000Z.
Why are these times different? Can I force them both to be 15 sec long?
Also, it seems to me that what I am trying to do would be a common thing that others in this community might have already done. If yes, please direct me to any things that are already set up that you think I should be looking at RE what I am trying to do.
Thanks,
~ Alan Kafka
RS_Notebook.ipynb (200 KB)