what does "print st_deconv" immediately before the simulate() call say?
I think I had errors like that with traces only 1 or 2 samples long before.
Without having the data it is hard to say more about the problem.
If you have ipython >= 0.11 you can debug the problem putting
On a side note, you should have a look at the methods defined on
Trace/Stream, there is a detrend convenience method there that can be
used for demeaning/detrending.
beside the suggestions of Tobi, we fixed a but in the instrument
correctionon 8. Sep (commit 89f7489d0693b, #396) and to my knowledge
did not release since then.
Therefore, it could as well help to upgrade your obspy installation
to the development master. This should work without problems on your
linux box.
Therefore, it could as well help to upgrade your obspy installation
to the development master. This should work without problems on your
linux box.
We plan to make a new stable release on the weekend, so depending on how
you installed ObsPy on your machine you might want to consider waiting
till next week and save yourself some effort with the installing..
I think your scipy demean/detrend calls are the problem. I'm not sure
what those will do when they get fed an ObsPy Stream object (they
usually work on array, e.g. Trace.data). As I said, we have convenience
methods for that job. Try the following for a start.
(I didn't understand why you wanted to set up your own header information.)
I finally managed to remove instrument response using the obspy.signal.invsim.seisSim function after upgrading obspy version and using python 2.7.
To be sure the result was good, I compared the deconvolution computed with obspy (SeisSim) and the deconvolution computed with evalresp (sac method).
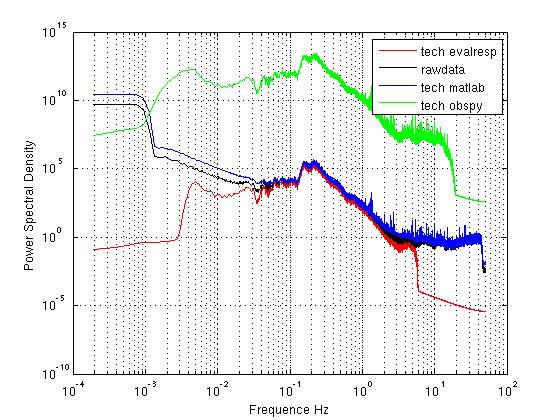
I have a problem of sensibility when removing instrument response with seisSim. Whereas the signal deconvolved with evalresp (sac) has the same sensitivity as the raw signal, the signal deconvolved with seisSim has a wrong sensitivity (see attached PSD.jpg file).
I enclosed as well the RESP file I am using. The instrument installed at the seismic station are a Trillium 120PA + a Taurus.
I noticed that changing the "A0 normalization factor" (B053F07) in the resp file modifies the sensibility of the deconvolved signal whereas modifying the Sensitivity (B058F04) does not change anything. Would it be a point?
instrument response is one of the most complicated issues that we handle
in obspy.signal. Possible problems can come from many different sources
-- misunderstanding the documentation, wrong response data, influence of
FIR filters, actual bugs in the code, etc. etc.
It would be so much easier to say something about your problem if you
would provide a complete and concise example. For example the code you
used to compute the line labelled "Obspy" in the plot is missing (also,
since there is no read support for RESP, you can not use that file
directly in the code but have hardcoded the respective information in
this part of the code, i assume?). If you provide all the data files (a
shortened piece of the data of course) and complete code to demonstrate
the issue, somebody probably could help you understand what is going wrong.
Thanks for your quick reply. You will find enclosed:
- The program I use: pre_proc_test.py
- The file resp: (RESP.YP.CT25.00.HHZ)
- The raw data file: YP.CT25.00.HHZ.D.2012.244
- A picture showing the PSD of different deconvolved signals using different methods (evalresp, matlab and seisSim/obspy) where we can see that the signal deconvolved with obspy has a wrong sensitivity.
I hope the files will help.
Moreover, as I already wrote, I noticed that changing the "A0 normalization factor" (B053F07) in the resp file modifies the sensibility of the deconvolved signal whereas modifying the Sensitivity (B058F04) does not change anything.
The sensitivity factor should be the one which is in B058F04 in the resp file. Maybe Seissim does not read the good factor in the resp file?
The file that I deconvolved with evalresp/sac is the same miniseed file that I deconvolved with Obspy and the resp file is the same. I do not have the sensitivity problem with evalresp/sac however.
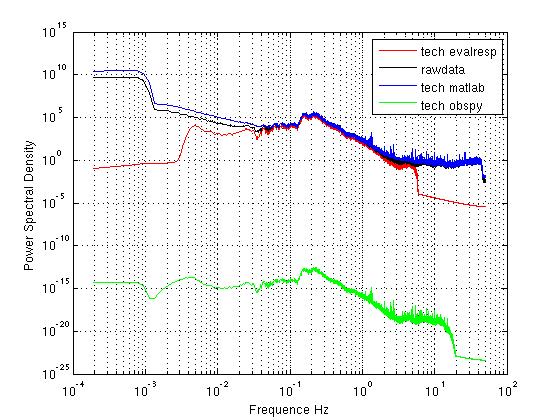
your PSD plots are confusing me. Once the line you identified as
problematic is 1e8 *above* the supposedly right lines, once it is 1e8
*below*. Also, the values in the PSD for raw data and the deconvolutions
you identify as correct are almost the same it seems. Do you think that
is reasonable?
The whole issue is a bit confusing to me.
* Running your script (deconvolution via obspy using evalresp) I end up
at peak values in the order of 5e-5.
* using the poles, zeros, A0 and stage sequence 0 sensitivity from your
RESP file and using Obspy's internal PAZ deconvolution (with a water
level of 10 -- btw, water_level is ignored if you use evalresp option in
obspy, i think) I end up at peak values in the order of 5e-6.
* Converting your MSEED to SAC and using SAC to deconvolve (commands
below) I end up at peak values of 5e5.
I would check if the RESP file is OK. Do you know the source personally?
Is there a chance to get a different file to cross check (e.g. a
dataless SEED)? Also, what values are you expecting? Can you make a
plausibility check with a another, comparable/nearby station? Is this
happening for many stations or is only this one station making problems?
Also, when you talk about changing B058F04 I hope you are aware of the
different stages in the response information. As far as I know evalresp
is not using stage 0 but all the other stages. However, I am not using
SAC and not using the evalresp based deconvolution in Obspy, so I fear I
probably am not able to give further help on this.
best,
Tobias
SETBB RESP "RESP.YP.CT25.00.HHZ"
r raw.sac
RTR
TAPER
TRANSFER FROM EVALRESP FNAME %resp TO VEL FREQLIM 0.001 0.005 10 20
Using response from user-specified file: (RESP.YP.CT25.00.HHZ).
Extracting evresp response for CT25, HHZ...
Station (CT25 ), Channel (HHZ )
WRITE sac_deconv.sac
You are right, I sent 2 different PSD plots because, I tried to changed the sequence 0 sensitivity of my Response file to check if this parameter was taking into account when deconvolving with Seissim/obspy. It seems it is not.
Then, i changed the AO parameter in the resp file and then the sensitivity changed (I should have sent the first PSD plot at that time).
Well, the PSD plot I sent today is the one performed when deconvolving with the original resp file.
Anyway, in both case, the PSD plot shows that the signal deconvolved with obspy/seisSim has a wrong sensitivity (green plot). I was expecting the signal to have the same sensitivity as the raw data (black line) as the deconvolved signal with sac/evalresp is.
If I plotted the PSD, it is because it helped to check if the deconvolution was well performed. That is how I realized the sensitivity problem.
I wanted to deconvolve my data using Seissim/obspy but with this kind of result I cannot.
Hi Coralie,

sorry for my interference; just want to put several things straight.
First of all you should be certain that you are working with the same
physical units - obspy as well as evalresp are working with m/s while
I'm not so sure regarding SAC (nm/s?). Second: Obspy.seissim takes the
sensitivity of the paz dictonary file (here 1.25829 10) and divides
the raw data (counts?) by this value. This is correct as long as your
SAC data are in counts (not in uV or other units). The same is done by
the evalresp-module but here the sensitivity is computed out of the
several stages of your Seismometer/DAS chain given your RESP file. What
I do not understand is why RAW data (in my opinion non deconvolved,
counts) should end in the same spectral amplitude values than corrected
one. Assuming that your SAC files are in counts the Peak2Peak values are
roughly 50000 counts - we divide this by 1.26 10 which gives 4. 10-5.
This value squared and divided by a bandwidth of 100 Hz gives roughly
10-12 (m/s)/Hz, a value which is at least close to the amplitudes
shown in your plot.
Changing the sensitivity in the RESP file will not influence the
evalresp module result as it is not used but computed (you have to
change the seismometer gain e.g. 1200 V/m/s or the gain of the
decimation filters).

In order to solve this issue, please be precise about the units and the
different ways of correcting for sensitivity used.

Hope that helps a little bit to clarify.
Best Joachim
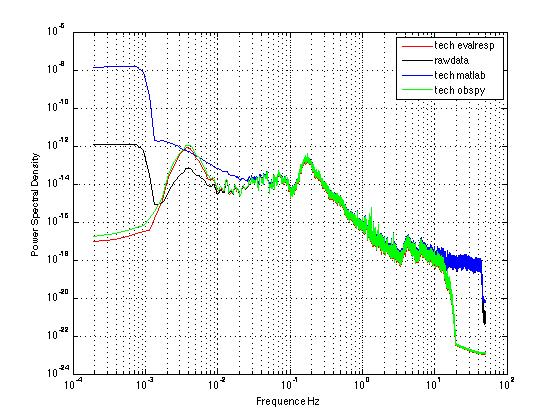
I realized that I confused with the units. You are right SAC works in nm/s as the other in m/s. Well, I rectified my programs and now it works. Here is the plot.