I have some problems with the ppsd.plot_temporal().
I loop through my data (one station, one channel) hour by hour using st.slide() and inside the hourly loop I call ppsd.plot(), ppsd.plot_spectrogram() and ppsd.plot_temporal([0.1,1,10]).
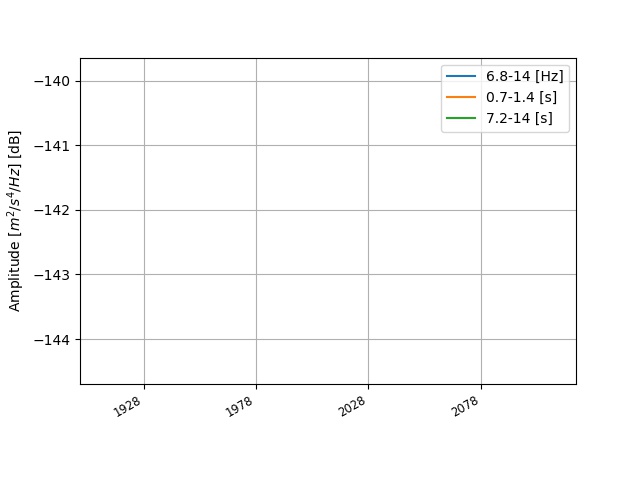
Plot and spectrograms pop up as they should, while temporal does not (attached). Seemingly the time limits in my case is in years, instead of hour??
Why are you windowing your time series data outside of PPSD? It seems
what you're doing is basically create one PPSD instance for each
individual time slice you want to process. You end up with trying to
make temporal plots and spectrograms with only one data point in the
time history. This is not how PPSD works. You should just add all data
into the same PPSD instance like demonstrated in the docs and tutorial.
No need to do the slicing yourself, it's all handled by PPSD. Just add
the streams read in from file as a whole. You can single out individual
data at the end if necessary. You can adjust the length of individual
time slices being processed during initialization of PPSD: