I don’t see any obvious problems there. Can you try ppsd.add(st, verbose=True) and what is the return value of that command, it should be True if data was added and processed properly.
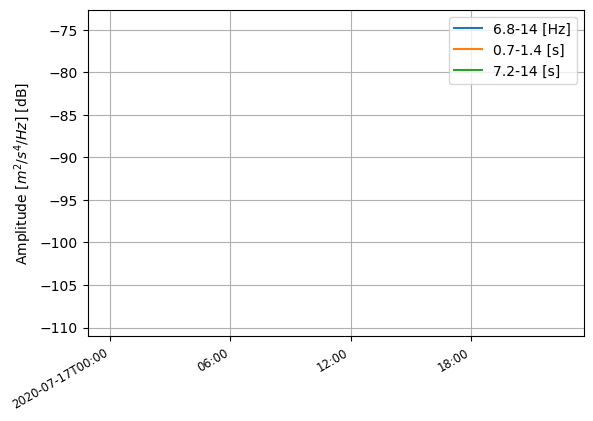
This seems to be a bug, looks like the time step is not properly incremented and then every second time slice isn’t processed, and when plotting the temporal plot it recognises these gaps and the plot probably ends up with single dots plotted that can’t be seen. I’m looking at it..
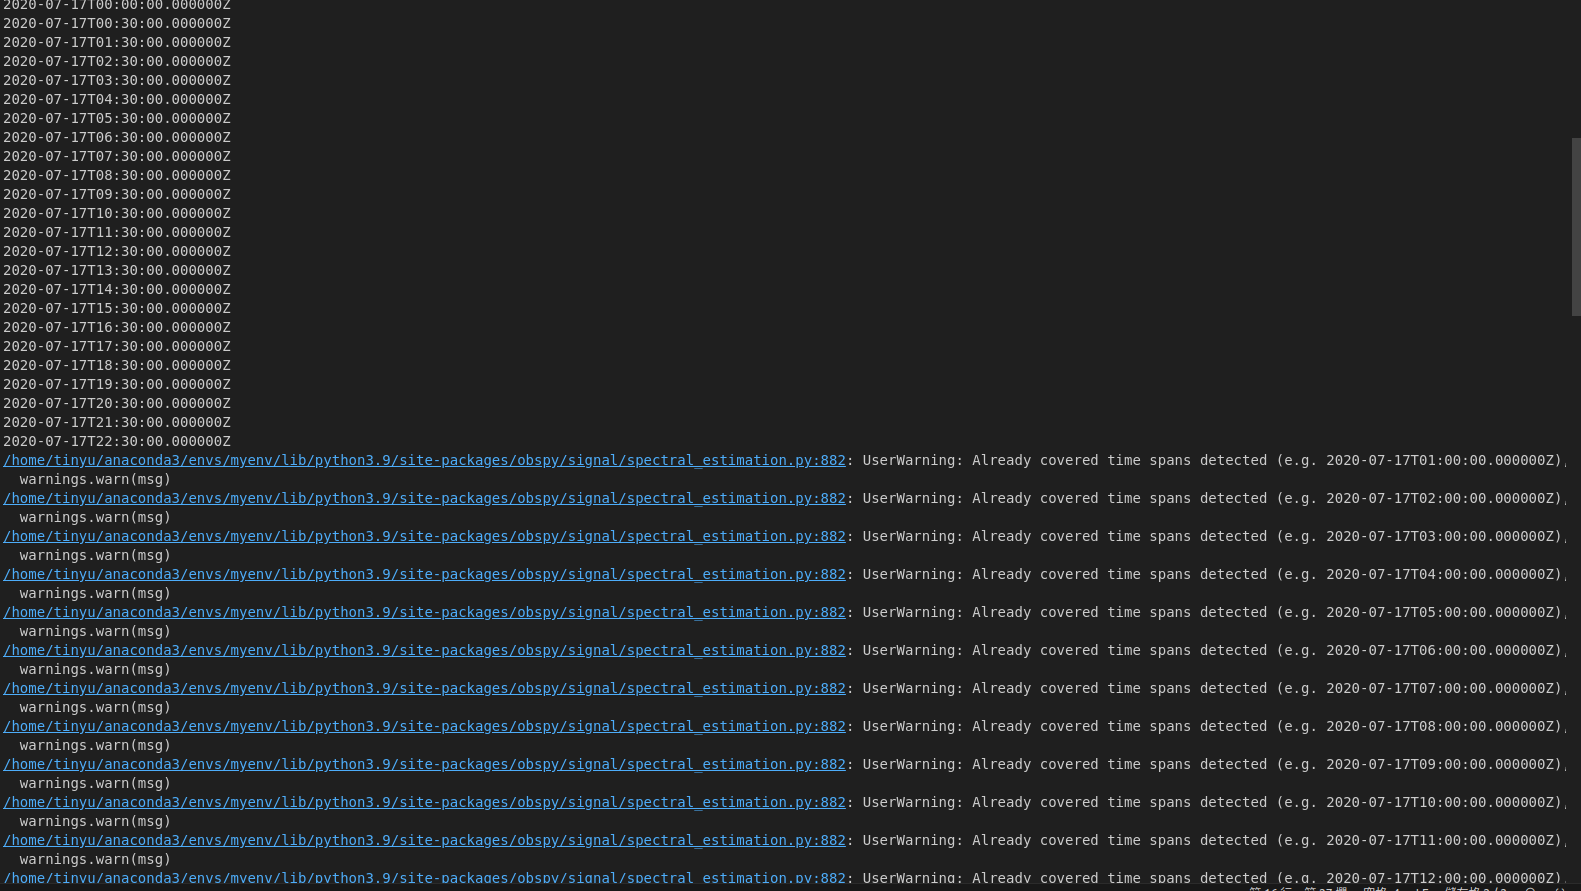
Somehow the sample times in the stream experience some kind of subsample creep, which eventually makes the PPSD processing think that every second slice of the trace should not get processed because it overlaps with the segment before.
It is pretty easy to fix in PPSD, even though I still need to double check if that fix causes issues elsewhere.
On the other hand, we need to look into how this happens in the first place because that is at the very core of obspy at the Trace level..
For a temporary solution you could make a new conda environment and install obspy from that branch of the pull request. I am still looking at where this problem is actually coming from, since it seems to come from core functionality
So, after chasing this issue for quite some time, turns out, the problem comes from how SAC is storing sampling rate information, it seems. See the linked obspy issue for more details.
@tinyulin0000 what you could do as a quick short term fix is to fix the sampling rate and get rid of the single-precision inaccuracy. Obviously, you need to take care that the sampling rate is what you expect it to be..
st = read("...")
for tr in st:
    assert tr.stats.sampling_rate - 25.0 < 1e-5
    tr.stats.sampling_rate = 25.0
...
ppsd.add(st)
Sorry for the late reply and thank you very much !
I also thought the problem result from my data file, but I didn’t know the detail problem.
So I really appreciate your help very much!!!