you can not specify custom colors with the below call.
Two options:
- get data with get_percentiles() and plot it into the figure you make
with PPSD.plot() yourself
- use PPSD.plot() and modify the line colors on the plot afterwards using matplotlib API (Axes object has them stored in an attribute "lines" I believe, you can set a different color on these objects with matplotlib API matplotlib.lines.Line2D — Matplotlib 3.1.2 documentation)
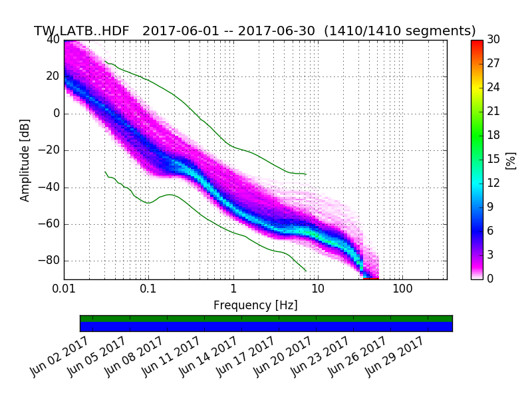
Following PPSD issue, I wonder if obspy already included or is planning infrasound high/low noise model for infrasound background noise analysis?
I did my infrasound PPSD using the model data from Bowman, J.R., G.E. Baker, and M. Bahavar, Ambient infrasound noise, Geophys. Res. Lett., 32, L09803, doi: 10.1029/2005GL022486, 2005.