Are there any examples of using the polarization.polarization_analysis module?
I attempt to run:
from obspy.signal.polarization import polarization_analysis as pa

analysis=pa(st, 10, 0.5, frqlow=1, frqhigh=5, stime=st[0].stats.starttime, etime=st[0].stats.starttime+30, method='vidale', verbose=True)
where st is a ~10sec, 3-component stream w/ channels GHZ, GHN, and GHE.
When I run it, it seems to stall out and nothing executes, I wait at least 2 minutes then ctrl+c out. I get this return message:
File "<__array_function__ internals>", line 5, in cov

File "C:\Users\nukenine\Anaconda3\lib\site-packages\numpy\lib\function_base.py", line 2492, in cov
c = dot(X, X_T.conj())

File "<__array_function__ internals>", line 5, in dot
KeyboardInterrupt
If it doesnt complete, did you try to make your input stream shorter? Maybe make the time window larger? Just as first steps, since as long as it doesnt finish, there’s really nothing you can say about what’s going on..
Thank you for the help! I tried shortening the etime parameter to make the input stream only 10 seconds long. But, that still was taking forever to run and never actually finished.
So, I then used the trim command on my entire stream beforehand and cut everything to 10 seconds, then everything worked quickly!
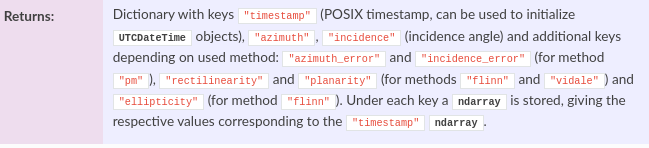
Question: the resulting azimuth array. Is each azimuth value related to a corresponding time value? I noticed that the azimuth array has slightly less data points than the traces in the stream. What has changed?
The azimuth values are where the amplitude is maximum?
And, the azimuth values are angles from 0 deg North to the station? So I can compute a backazimuth to the event from here?
I’m actually so dumb, I was focused on the azimuth/incidence/etc. that I skipped right over timestamp. Thank you.
Yes, the stream length issue was strange to me, but for anyone else reading this in the future, cutting a copy of the original stream down instead of relying on the stime and etime input parameters worked for me.
Also, not sure but it not finishing might be connected to GitHub · Where software is built, which seems to raise some problems hinting at too many time windows being used for calculation..