I have events that I whant to plot in picture as single events inserting some info in picture, like as info that I can insert in events picture when I creating a one-day plot with type parameter = , ‘dayplot’.
I have try to do that, but I’m managed only to plot wave with only station code inserted in picture. I’m try to add other info like star to initial position with time on P and S, or, best, add a little side baloon with principal info (P, S, Mag and so othe info to insert in)
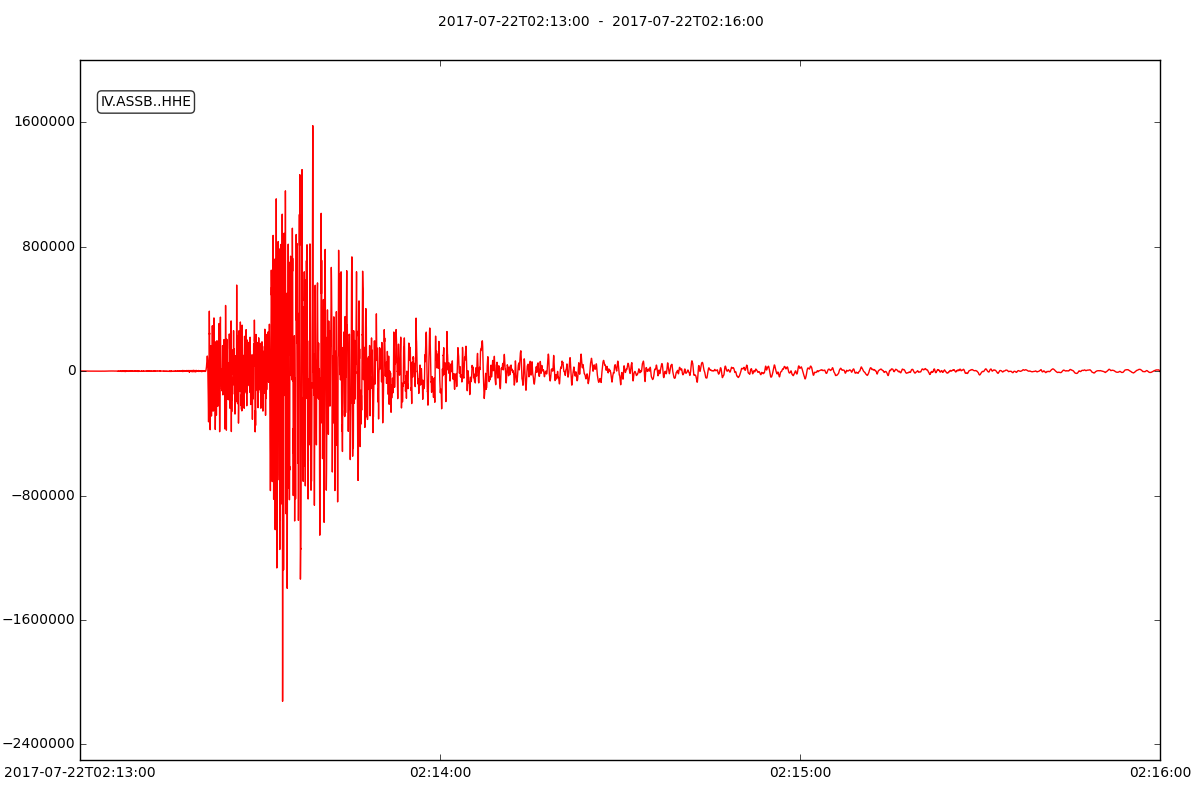
I whant to plot an event like the attached image.
As you can see, in the up left of the screen there is the station name.
I have look in trace, and I have found in the first index [0] these value: