Hi all,
in my attempts to learn the rf package, I’ve been following the tutorials provided on the docs, and found that the plot_profile() function seems to be trimming the traces. Here’s what I mean:
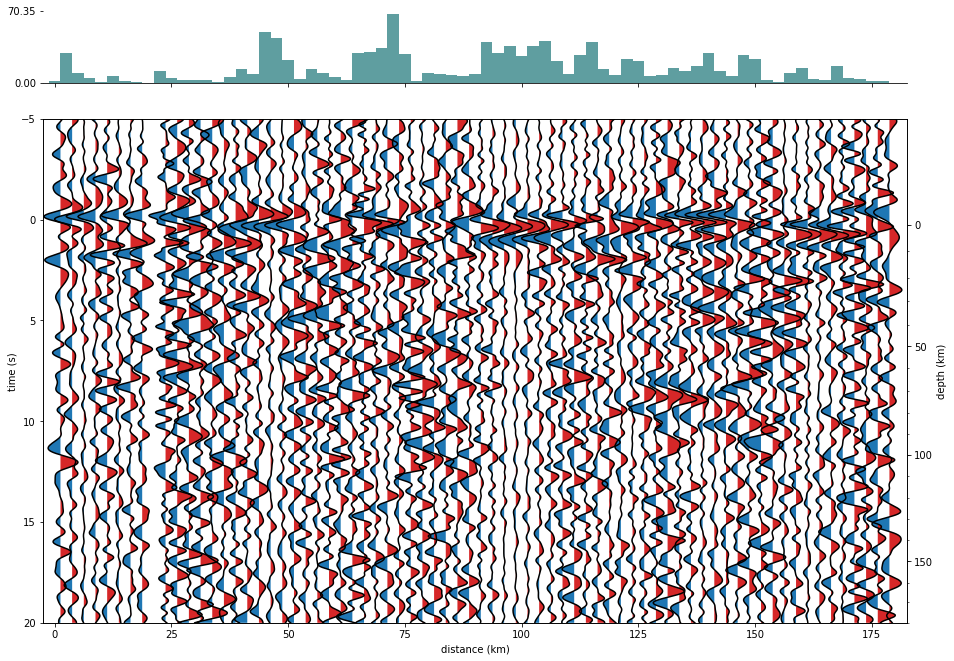
Here’s what the plot from the tutorial looks like. This is what I was expecting to get:
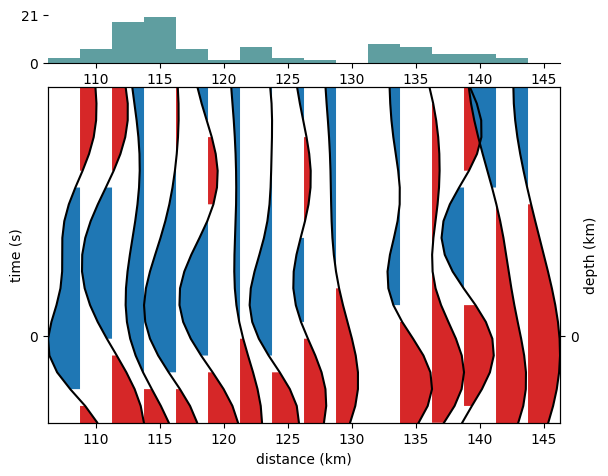
This is what I’ve been getting. I reduced the plot down to just one station, CX.PB01, to speed up computing (and thus debugging):
And finally, the code I used:
pstream.trim2(-5, 20, ‘onset’)
pstream.select(channel=‘??Q’).normalize().plot_profile(top=‘hist’)
plt.show()
Any fixes/insights would be greatly appreciated! 
Hi!
I downloaded the notebook and I can confirm your issue.
The labeling of the depth axis is not working anymore. I have to check why.
For now you can use the plot_profile() method with moveout_model=None to generate a plot without depth tick labels.
I seem to have found a workaround, which is simply hard-coding the y limits of the figure after calling the plot_profile method.
So it appears that the method isn’t correctly setting the limits which looks like a bug, unless there’s something I’m missing. Thoughts?
Yes, you are correct. It appears, that matplotlib changed the behavior of Axes.shary to automatically change the y limits.
I added a commit to the rf repo that hopefully fixes the bug. Maybe you can check it out to see if it works for you.
Edit: I created a new release with the fix. Thank you for raising this issue!