Hi everyone, working on Sp RFs and found that plotting the profile with plot_profile results in no positive thickmarks for both time and depth axes, which is not the case as for Ps RFs (like in the tutorials). See the figure below:
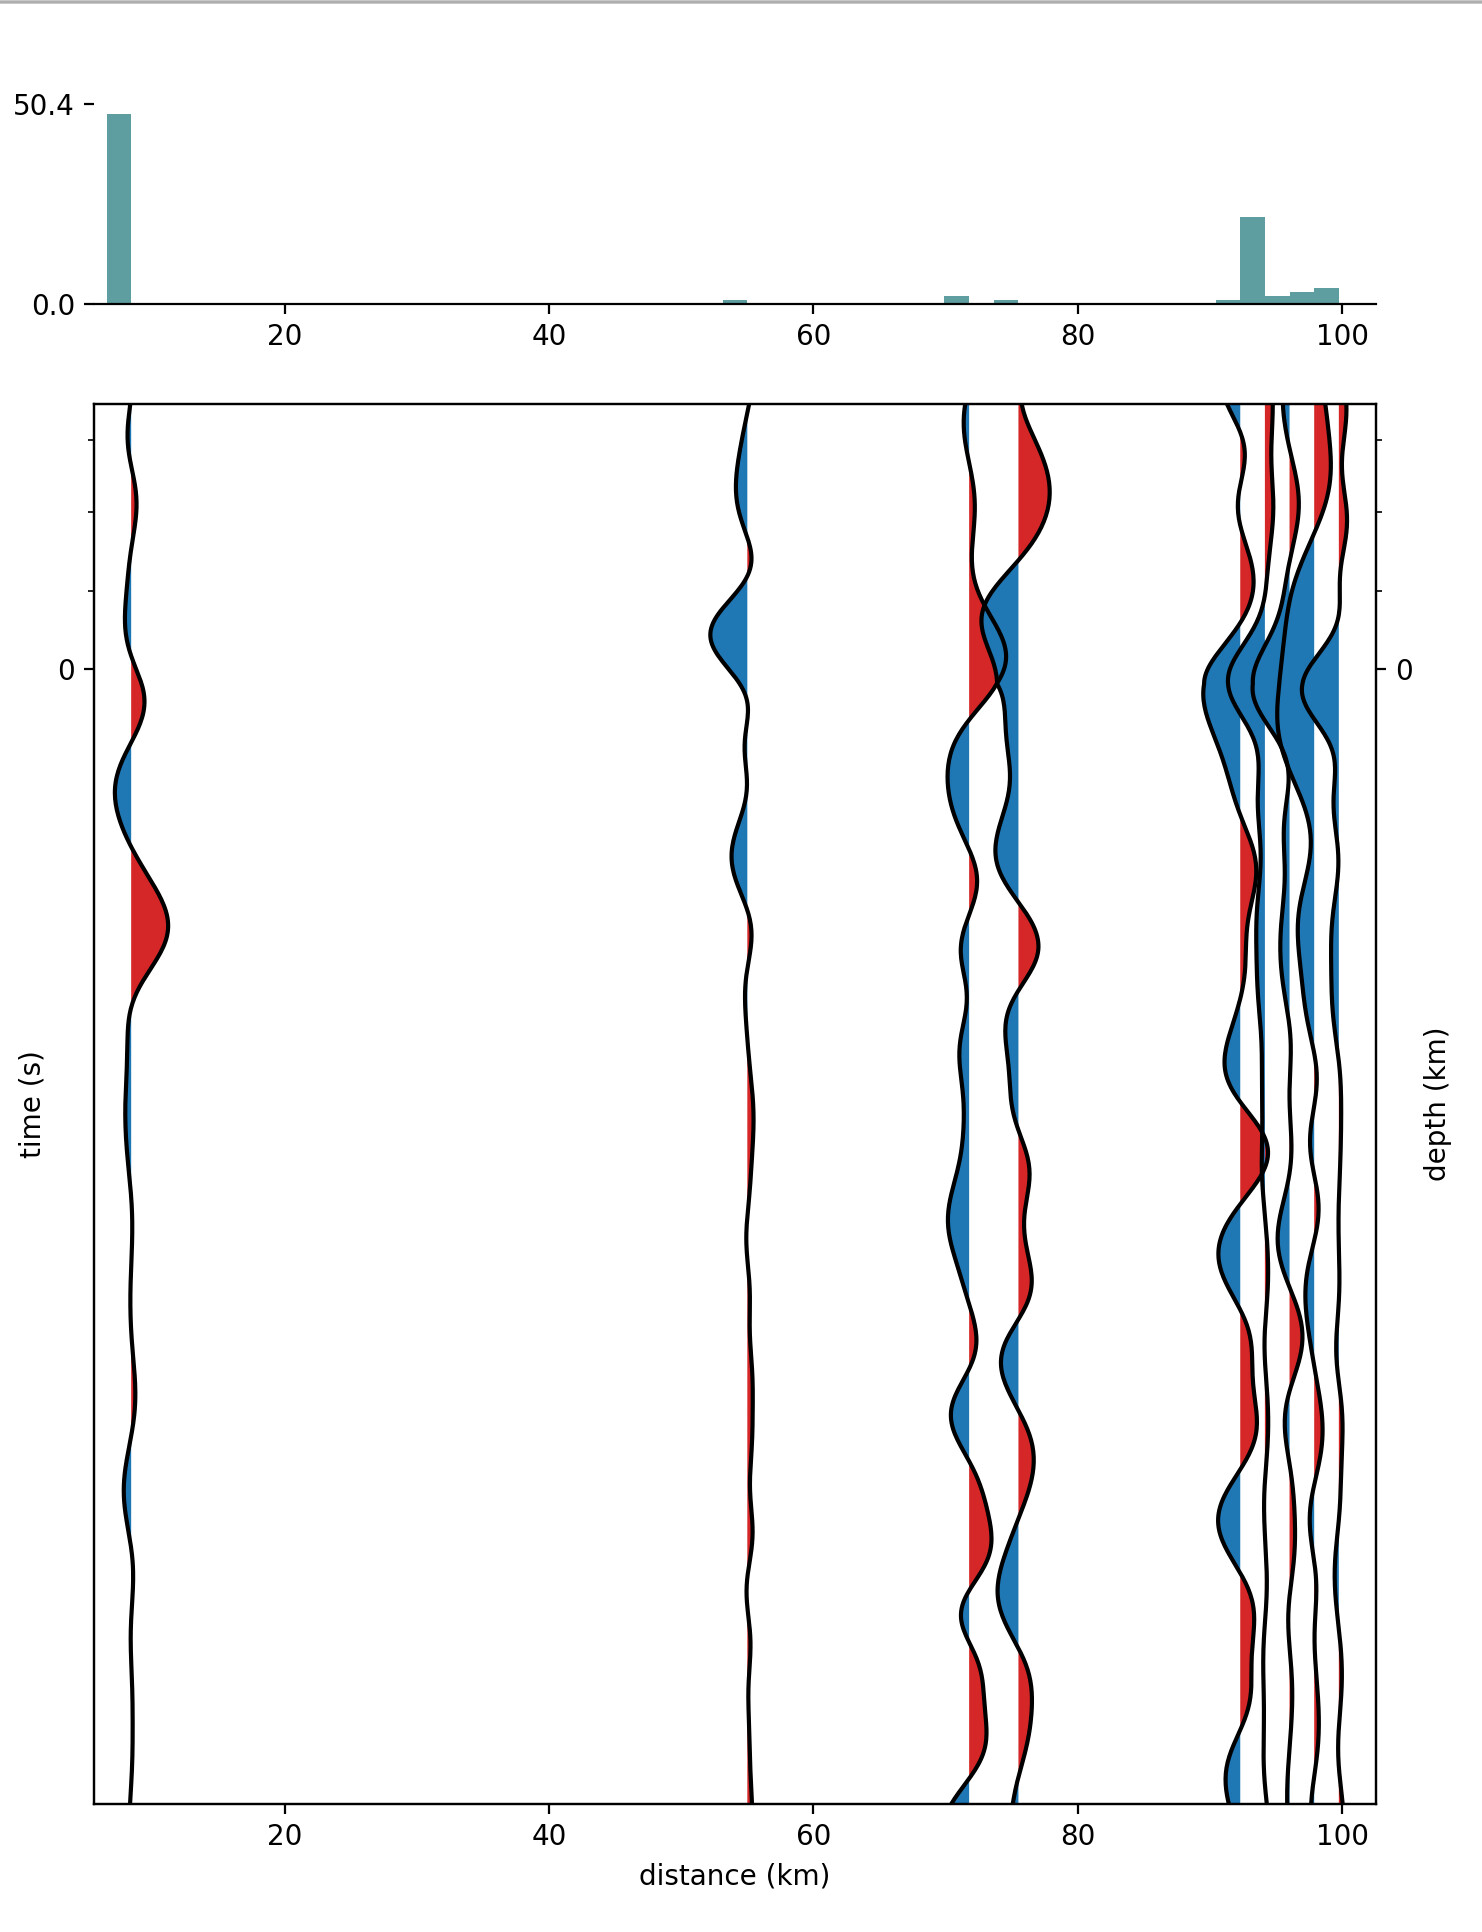
I understand that the delay times for Sp phases should be negative since S arrives after the converted phases, but my understanding is that within the rf method Sp receiver functions are time reversed for better comparison with Ps RFs.
I think this is resulting in plot_profile not showing the expected depths and times.
A simple fix is to add something along the lines to the plot_profile function
if moveout_model:
    from rf.simple_model import load_model
    model = load_model(moveout_model)
    phase = profile[0].stats.moveout
    slowness = profile[0].stats.slowness
    # This is the modification
    if rf_method == 'S':
        pd = -1 * model.calculate_delay_times(phase=phase, slowness=slowness)
    else:
        pd = model.calculate_delay_times(phase=phase, slowness=slowness)
    ylim = ax.get_ylim()
    ax2 = ax.twinx()
    # ax.sharey(ax2)
The above works (for Sp RFs), but not sure if this qualifies as a bug, of if I missed a step in the processing.
@trichter thank you for developing rf I think is a great project.
Best