Hi all,
I am trying to write station name label on a horizontal section plot with distance in degrees using the function here under:
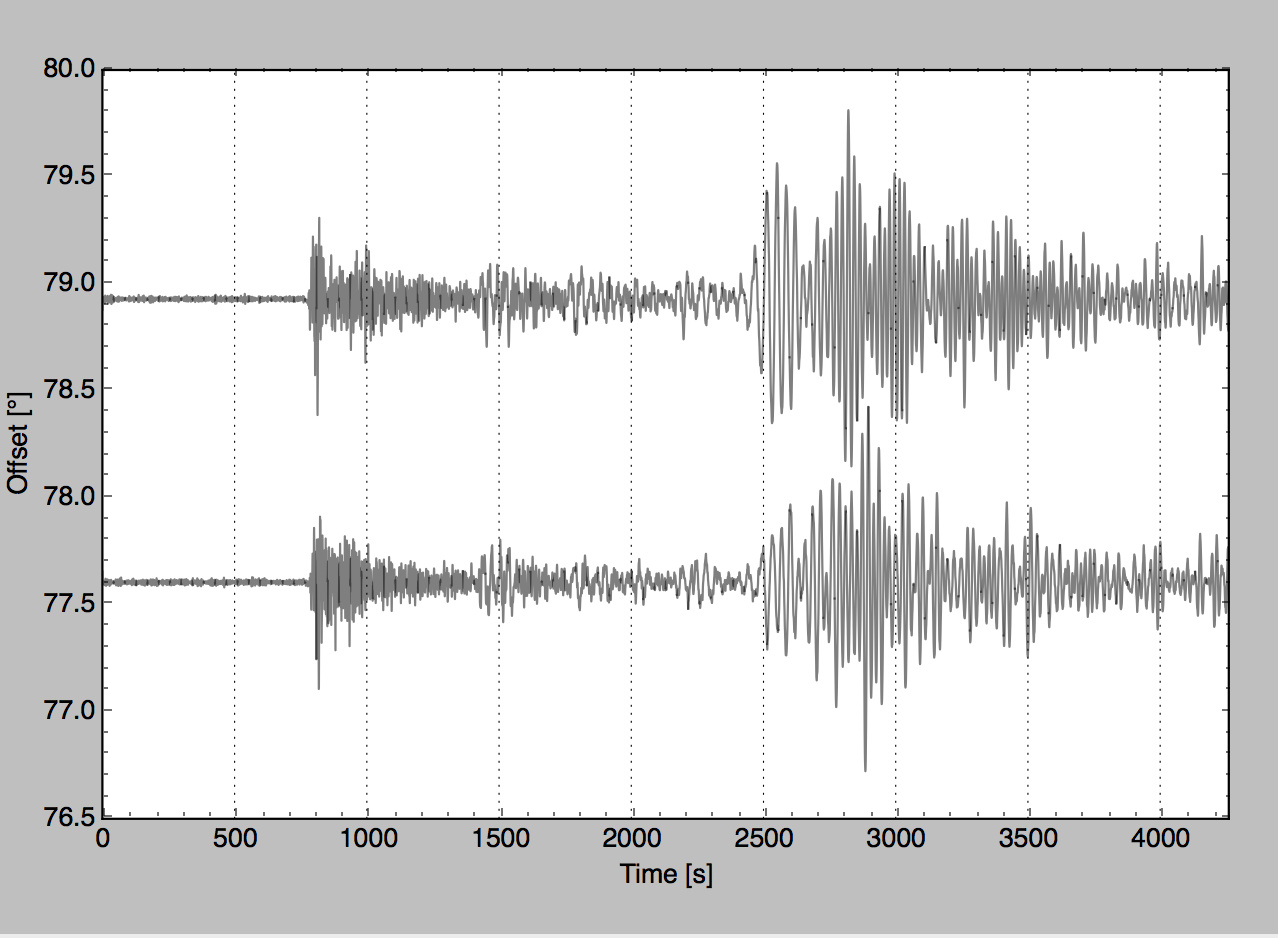
st.plot(fig=fig, type='section', dist_degree=True, scale=2, orientation='horizontal', ev_coord=(evla, evlo))
Here is the plot. I would like to add the station name labels at the right side of the plot, closed to each plot.
I don't know how to do it. Do you have an idea?
Regards,
Coralie