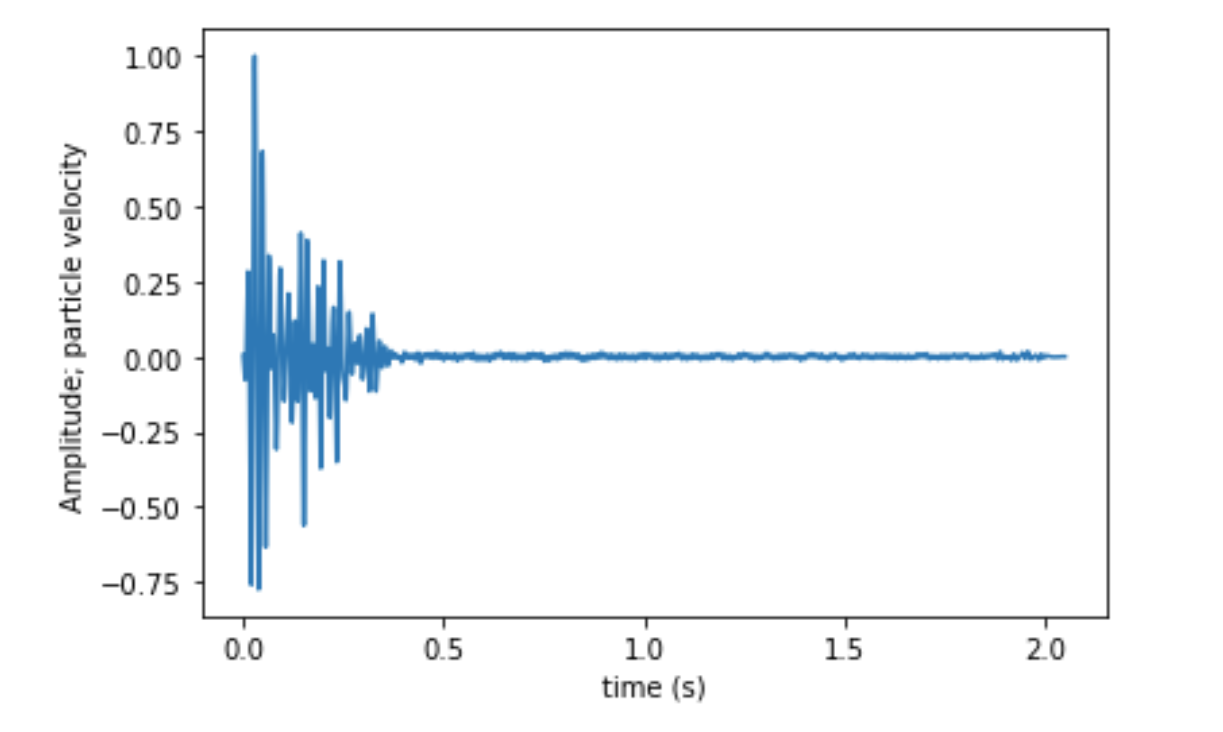
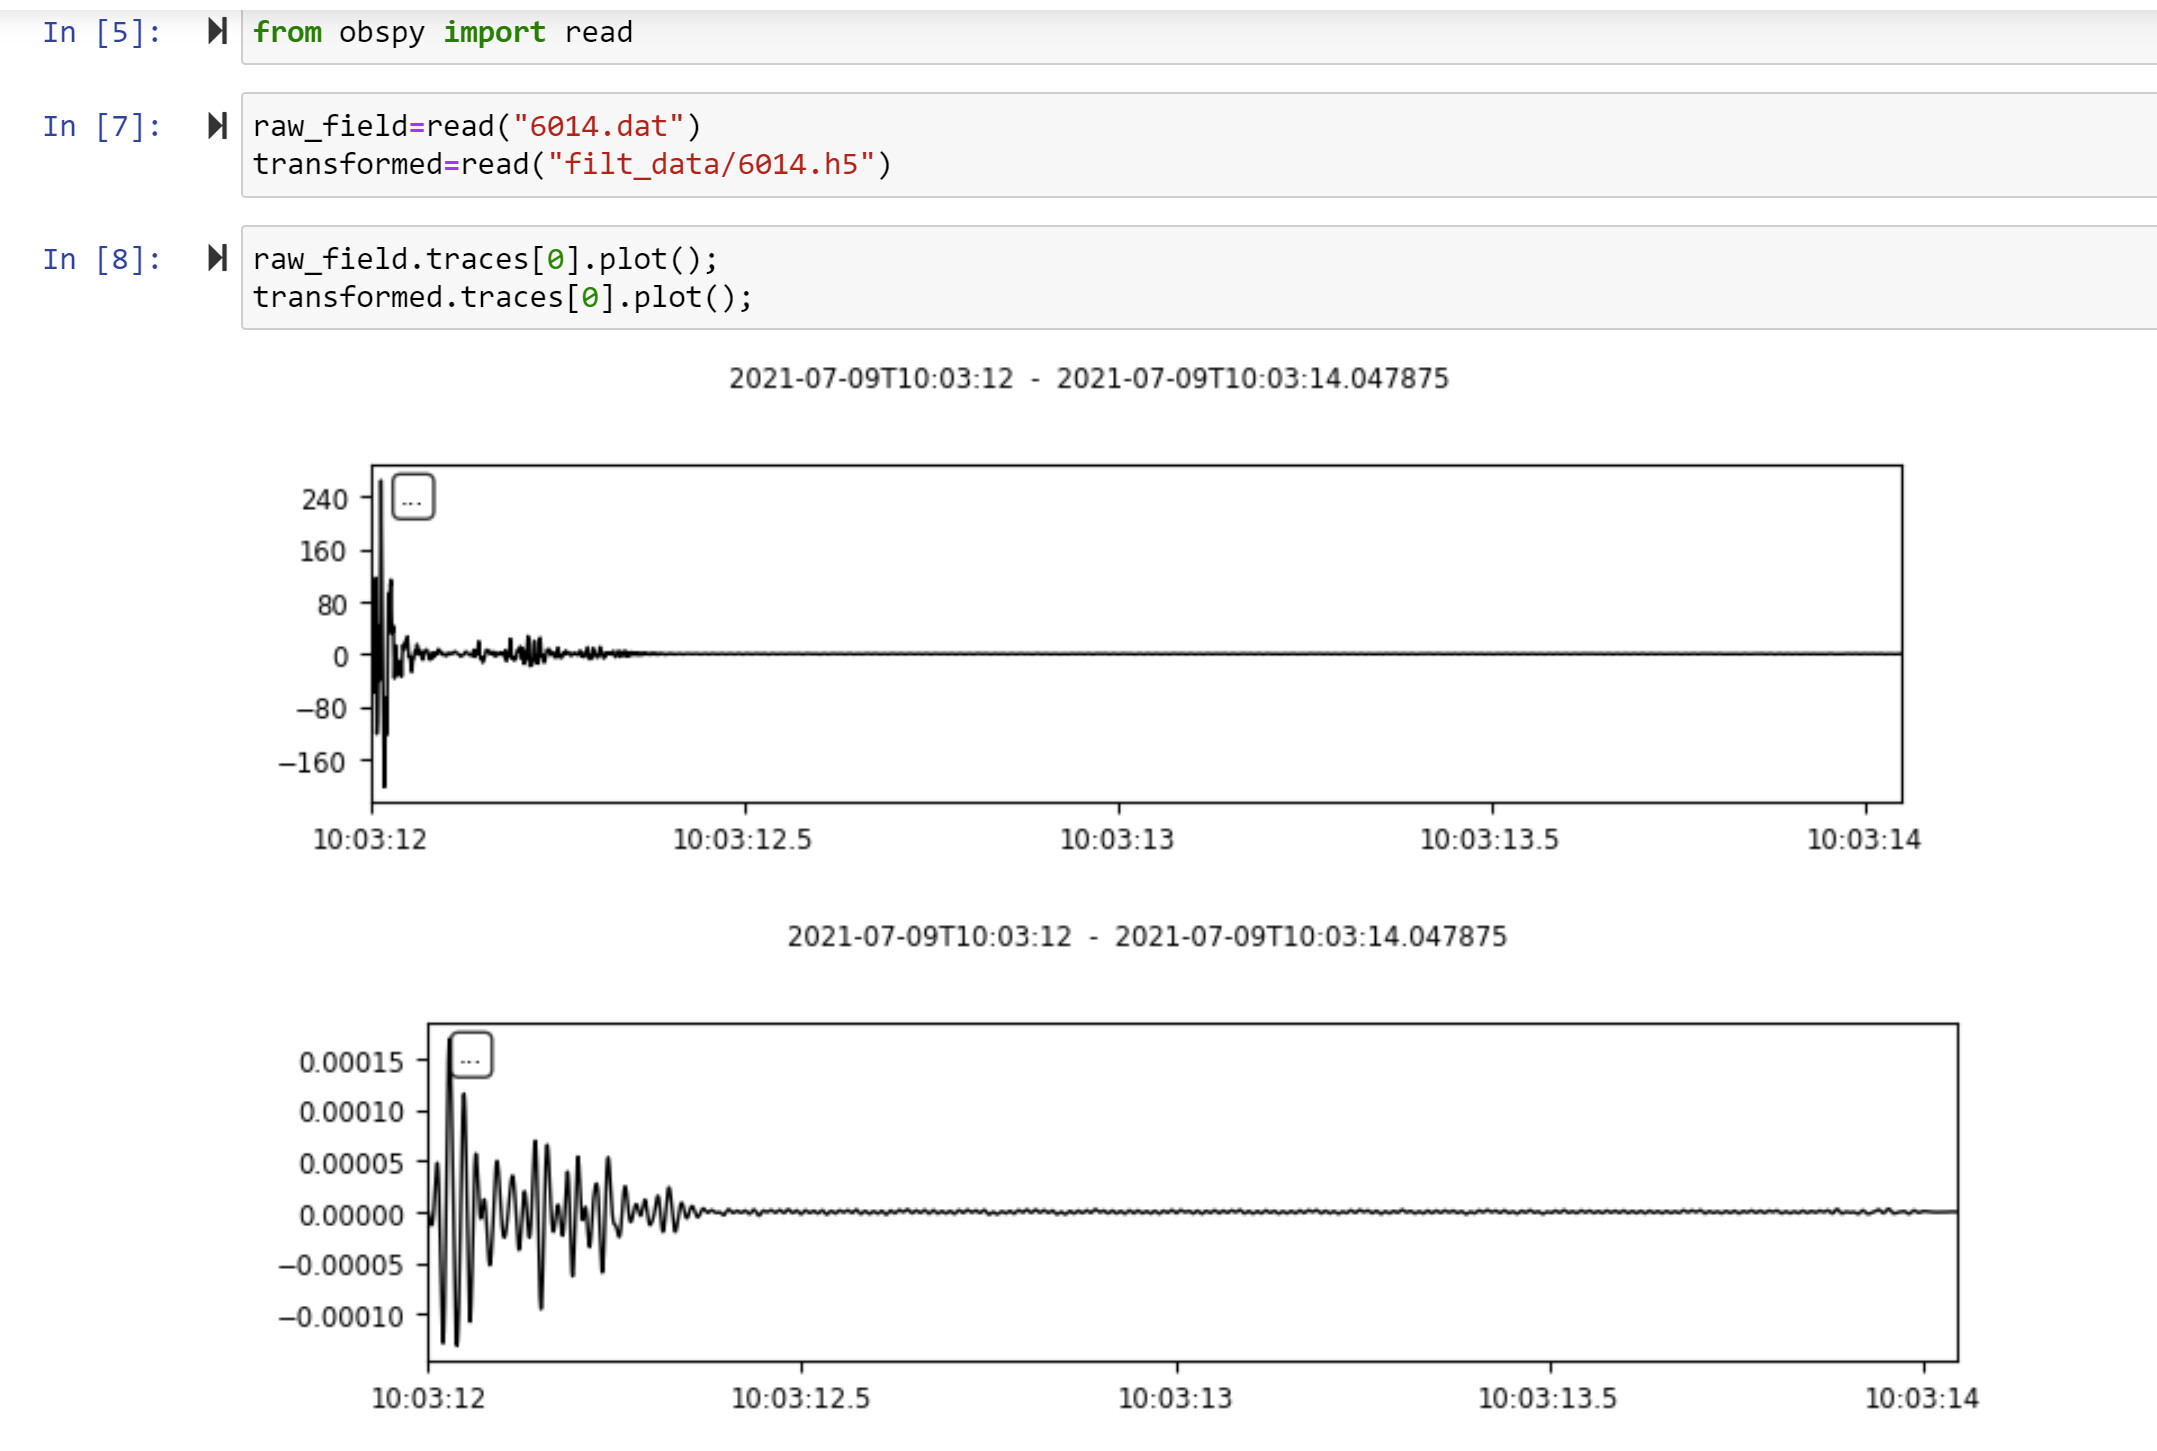
I have normalized a dataset and saved it into a new file (basically, the data for each receiver should be less than 1). However, when I use file.plot() the amplitude that is being shown is nonsense:
I don’t think we have enough information about what you were doing and what you wanted to do to help right now. No plotting function itself will take instrument response into account by itself, you have to do an instrument correction to go from digital counts to physical units if that is what you want and then do the plotting afterwards.
As is observable, the amplitude is between (-1,1), while it is much smaller when I used the plot function (As I said, I intentionally normalized the raw field data and saved them as " transformed").