Hi everyone,
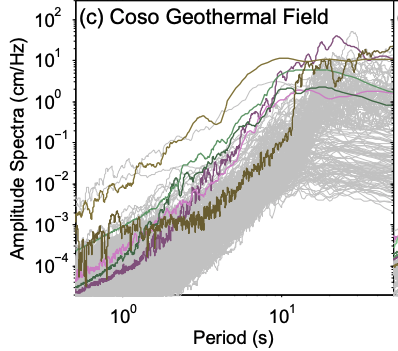
I am looking for obspy function to plot the amplitude spectra of the vertical waveform.
Here is my script
import numpy as np
from obspy import read
from obspy.clients.fdsn import Client
from obspy.geodetics.base import gps2dist_azimuth
from obspy import UTCDateTime
from datetime import datetime
from datetime import timedelta
import pandas as pd
client = Client("IRIS")
T_P=events["P_Time"]
ev_lat=events["lat"]
ev_long=events["long"]
ev_dep=events["depth"]
station_latitude=45.90
station_longitude=-130
PGV_Z=[]
for a in range (110, 111,1):
    time=T_P[a]
    time=UTCDateTime(time)
    depth=ev_dep[a]
    starttime=time-timedelta(minutes=10)
    endtime= time+timedelta(minutes=30)
    net = "OO"
    sta = "AXEC2"
    loc = "*"
    chan = "HHZ"
    st = client.get_waveforms(net, sta, loc, chan, starttime, endtime, attach_response= True);
    st_rem=st.copy()
    st_tr=st_rem.remove_response(output = 'VEL',plot=False);
    st_filt=st_tr.filter('bandpass', freqmin =0.001, freqmax=0.1)
    st_f=st_filt.detrend('demean').detrend('linear').taper(0.05)
    st_f.plot(equal_scale=False, automerge=False);
    data=st_f[0].data
    pgv=max(data)
    PGV_Z.append(float(pgv))

print(PGV_Z)
Here is what I required.
There is no out-of-the-box function to plot amplitude spectra in ObsPy. The PPSD class plots probabilistic power spectral densities. You can simply use numpy, scipy or even mtspec functions to calculate the spectra and plot it with matpotlib.
An example to plot the amplitude spectrum of a trace:
import matplotlib.pyplot as plt
from scipy.fftpack import fft, fftfreq, next_fast_len

def plot_spectrum(tr):
    """Plot spectrum of ObsPy trace"""
    tr.detrend('demean')
    #tr.taper(0.5, 'hann')
    sr = tr.stats.sampling_rate
    nfft = next_fast_len(tr.stats.npts)  # pad data with zeros for fast FT
    pos_freq = (nfft + 1) // 2  # index for positive frequencies
    spec = fft(tr.data, nfft)[:pos_freq]
    freq = fftfreq(nfft, 1 / sr)[:pos_freq]  # get freqs of DFT bin
    plt.plot(freq, np.abs(spec))
2 Likes
Hi, thanks for your suggestions, I adopt the following approach to plotting the amplitude spectra. However, I need to normalize the spectra. May you suggest how can I fix this:
client = Client("IRIS")
T_S=CE["S_arrival"]
T_E=CE["S_end"]
ev_dis=CE["dist(km)"]
ev_m=CE["Mag"]
ev_dep=CE["depth"]
q=CE["Q"]
station_latitude=45.90
station_longitude=-130
fig,axs = plt.subplots(1, 1, figsize=(4,3), sharey=True, dpi=500)
for a in range (1):
    time=T_S[a]
    starttime=UTCDateTime(time)
    time_e=T_E[a]
    endtime= UTCDateTime(time_e)
    net = "OI"
    sta = "AXDD"
    loc = "*"
    chan = "HH*"
    st = client.get_waveforms(net, sta, loc, chan, starttime, endtime, attach_response= True);
    st_rem=st.copy()
    pre_filt = (0.001, 0.005, 45.0, 50.0)
    st_tr=st_rem.remove_response(output = 'VEL',plot=False, pre_filt=pre_filt, zero_mean=True, taper=True);
    st_dm=st_tr.detrend('demean')
    st_tr=st_rem.detrend('linear')
    st_filt=st_tr.filter('bandpass', freqmin =0.01, freqmax=0.05)
    tr=st[2]
    spec, freqs = rfft(tr.data), rfftfreq(tr.stats.npts, tr.stats.delta)
    plt.loglog(freqs,obspy.signal.util.smooth(abs(spec), 1), label="moving average", linewidth=0.5)
    axs.set_xlabel('Frequency (Hz)', fontsize=7)
    axs.set_ylabel('Amplitude Spectra', fontsize=7)
    axs.xaxis.set_tick_params(labelsize=5)
    axs.yaxis.set_tick_params(labelsize=5)
plt.show()
