Hi,
I have a DATALESS file with two stages for the poles and zeros, when I try to plot the repsonse curve using Obspy plotting method it just takes into account the first PAZ stage ignoring the second one, so plotting a wrong response curve. Is there any way to plot the repsonse curve considering all PAZ stages and not just the first one?
Can you share your station metadata file? Obspy uses evalresp for calculating the response which will by default take into consideration all stages.
resp = read_inventory(path_dless)
resp_ = resp.select(channel=‘HNZ’).get_response(seed_id=f’EY.RB16A.10.HNZ’, datetime=UTCDateTime(2020,1,1))
resp_.plot(min_freq=10**-4);
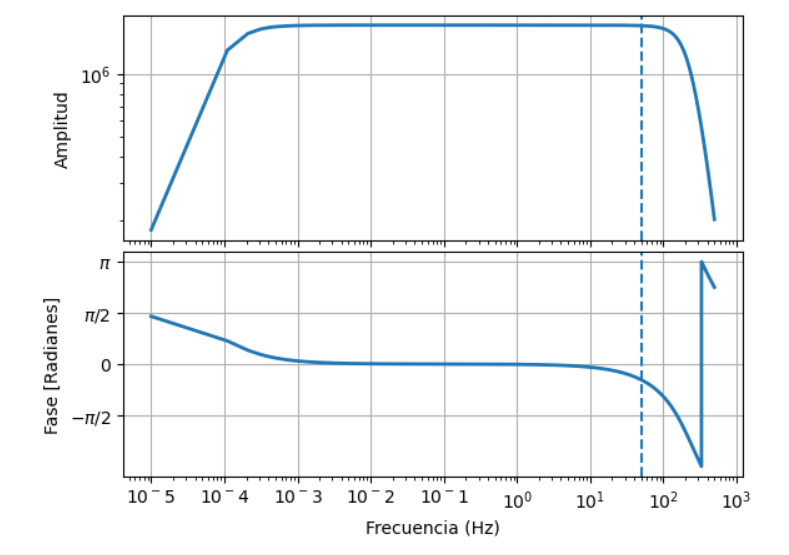
I manually calculated the response curve for the same channel and I got this:
but Obspy generates a different response curve.
Any idea of why the plots are different? If Obspy takes into consideration all stages, then I have no more ideas of why the plots are different
I already found the error. I was plotting the velocity response and comparing with acceleration response. My curves would never give the same. Thank you, I appreaciate your help!