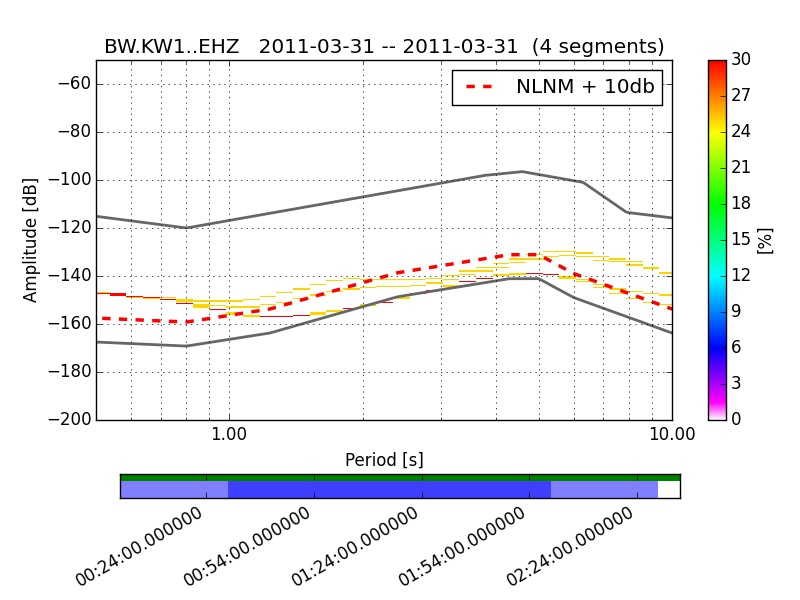
is it possible (by manipulating some ObsPy script…?) to modify the PPSD function of ObsPy such that I can change the plot output? I would like to change the range of the x-axis and if possible add extra lines for e.g. drawing a line that marks NHNM - 20 dB for a certain period range.
Sure you can edit the source files, but this is probably not the recommended thing to do. Instead its safer to extend the PPSD class with a new plotting function that does what you want. To ease this you may want to have a look at the original code of PPSD.plot(), this you will find here: � regP
..or just tweak the plot with matplotlib after doing the builtin PPSD
plotting, e.g.:
import matplotlib.pyplot as plt
from obspy.signal.spectral_estimation import get_NLNM
from obspy.signal.tests.test_spectral_estimation import _get_ppsd