Hello, I created this as a new issue also on github, but after seeing this discourse site maybe that was the wrong place to post it?
Obspy version 1.2.2
Python version 3.6 (also tried on 3.7)
I downloaded THIS quakeml file from the USGS, in an attempt to make plots similar to the maps and radiation pattern plots HERE. However, even when I explicitly write a beachball or p_sphere plot it will only plot the same projected map. How can I get similar plots to the one in the example of the obspy documentation linked above? Thanks!
from obspy import read_events

qml=read_events(/path/to/qml)
qml.plot(kind='local')
Will show this projection and not local:
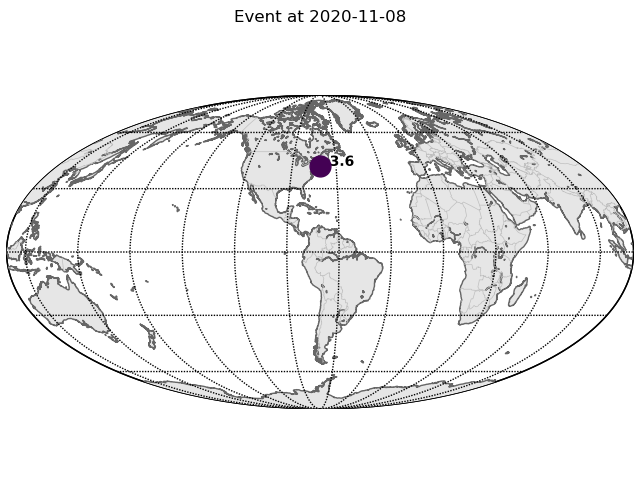
Additionally, when I attempt to explicitly plot the beachball and radiation patterns it will show only show the same plot:
qml.plot(kind=[['ortho', 'beachball'], ['p_sphere', 's_sphere']])
I get similar results when I read the generic quakeml file from obspy with:
test=read_events()
test.plot(kind=[['ortho', 'beachball'], ['p_sphere', 's_sphere']])