Hello everyone,
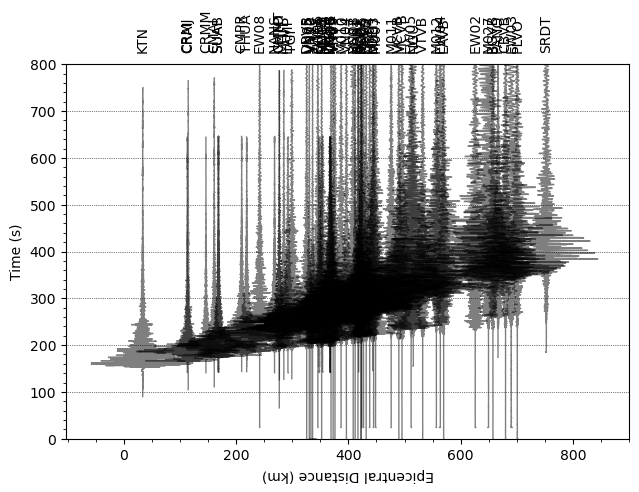
I am trying to plot waveforms from different stations with respect to their epicentral distance. Currently, my plot starts at the waveform’s start time, but I would like the waveforms to start at the earthquake’s origin time. How can I modify my code to achieve this?
Here is my current code:
from obspy import read, Stream
import glob
import matplotlib.pyplot as plt
from matplotlib.transforms import blended_transform_factory
all_z_data = glob.glob(“H?Z.SAC”)
stream = Stream()
for trdata in all_z_data:
tr = read(trdata)
#tr[0].detrend(“spline”, order=3, dspline=500)
#tr[0].filter(“bandpass”, freqmin = 1/40, freqmax = 1/5, corners=1, zerophase=True)
tr[0].stats[‘distance’] = tr[0].stats.sac.dist*1000
stream +=tr[0]
stream.plot(outfile=‘recordSection1.png’,type=‘section’,offset_max=900*1000, scale=15, orientation=‘horizontal’, linewidth=0.8)
Adjust y-axis limit
plt.xlim(-20, 500) # Set y-axis limit from 0 to 800 km
Set axis labels
plt.ylabel(‘Epicentral Distance (km)’)
plt.xlabel(‘Time (s)’)
Show the plot
plt.show()