I am an undergraduate student working on an array of seismic stations in Antarctica. I am very new to Seismology and receiver functions, and relatively new to python programming. I’ve used the rf package and followed the tutorial in Jupyter notebooks to calculate receiver functions and estimate the time lag between phases. I was able to successfully construct the plots, but now I’ve run into a conceptual problem: how do I determine the Ps arrival time from the Q component? From my understanding, the second highest peak should indicate to the arrival of the Ps phase, but it’s really hard to do that from these plots (see attached), given also the fact that there are some strange peaks at 0 sec (should they even be there?) and afterwards. What could be my next steps to improve these plots and find the lag times?
Hi!
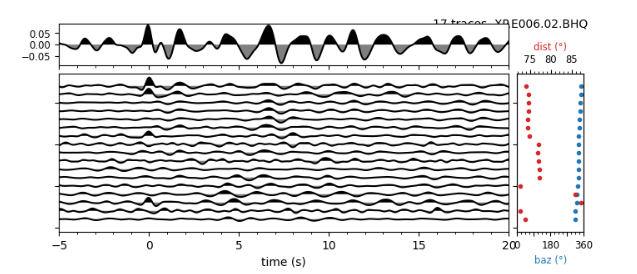
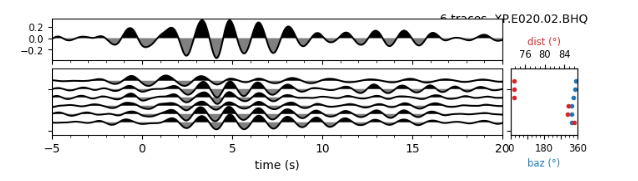
I always found interpretation of receiver functions difficult. Look out for consistent phases, e.g. the wiggles at ~7s at the station E006 look promising. Trying to improve your azimuthal coverage would help a lot, I guess. You can also compare different deconvolution methods and settings.
Wiggles at 0s are probably due to imperfect rotation or surface effects which is not uncommon.
As a quality check you can also look at the L component which should have a single peak at 0s.