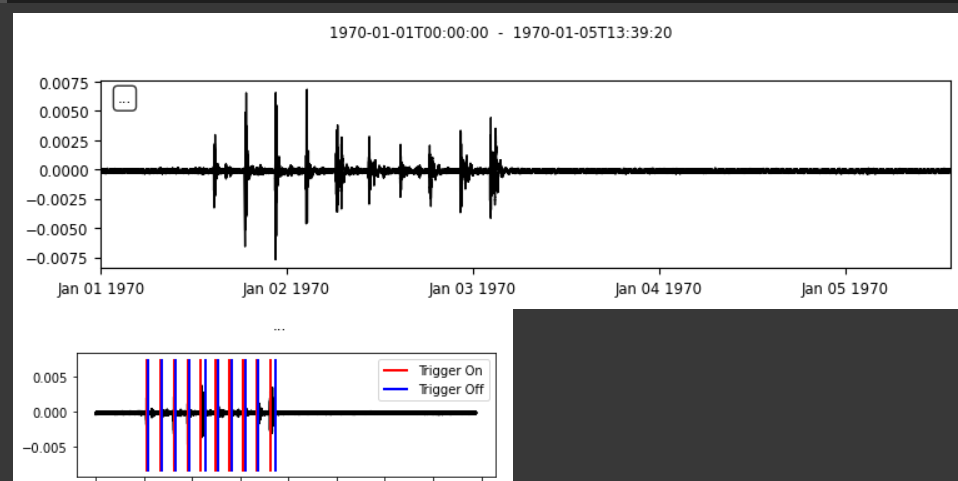
#Shown above here is my plot using my own data. How can I get the number of triggers from the plot? (Visually it’s 10, how to get the count of triggers). Also how can I segment each trigger events separately?
Put your characteristic function you get out of the trigger routine into this function:
1 Like
Thanks a lot! @megies