Dear Users,
I’ve been plotting spectrograms with ObsPy and am having difficulty getting the trace time to plot on the -axis. I’ve been using the following script and it plots the figure shown after it:
import obspy
from obspy import read
import obspy.io.css
import os
import sys
import scipy as sc
import numpy as np
import matplotlib.pyplot as plt
import pandas as pd
import matplotlib.dates as mdates
import matplotlib as mlab
#import matplotlib.dates as md
import datetime as dt
from obspy.imaging.spectrogram import spectrogram
my_data = (“http://examples.obspy.org/RJOB_061005_072159.ehz.new”)
st = read(my_data)
for tr in st:
fig = plt.figure()
Get timestamp info from trace object
te = tr.stats.starttime.timestamp
te2 = tr.stats.endtime.timestamp
x_lims = list(map(dt.datetime.utcfromtimestamp, [te, te2]))
x_lims = mdates.date2num(x_lims)
y_lims = [0,100]
#spectrogram(tr.data, tr.stats.sampling_rate, wlen=1., dbscale=True,log=False, cmap=‘jet’,title=str(tr.stats.starttime), show=False)
spectrogram(tr.data, tr.stats.sampling_rate, wlen=1., axes=ax, dbscale=True,log=False, cmap=‘jet’,title=str(tr.stats.station) +" " +str(tr.stats.starttime))
plt.title(str(tr.stats.station) +" " +str(tr.stats.starttime))
ax.set_ylim(0,tr.stats.sampling_rate / 2)
fmtr = mdates.DateFormatter(“%H:%M:%S”)
ax.xaxis_date()
ax.set_xlim(x_lims[0],x_lims[1])
ax.xaxis.set_major_formatter(fmtr)
ax = fig.gca()
ax.set_xlim(x_lims[0],x_lims[1])
ax.xaxis.set_major_formatter(fmtr)
ax = plt.gca()
fig.canvas.draw()
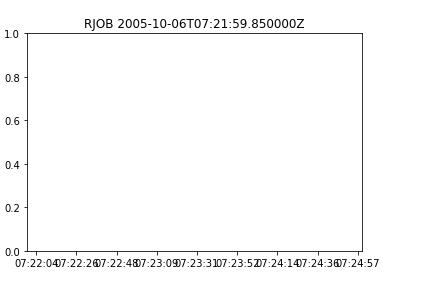
How do I get it to plot the spectrogram as well?
Any help you can offer would be greatly appreciated.
Have a great day!
Chip Brogan