Dear all,
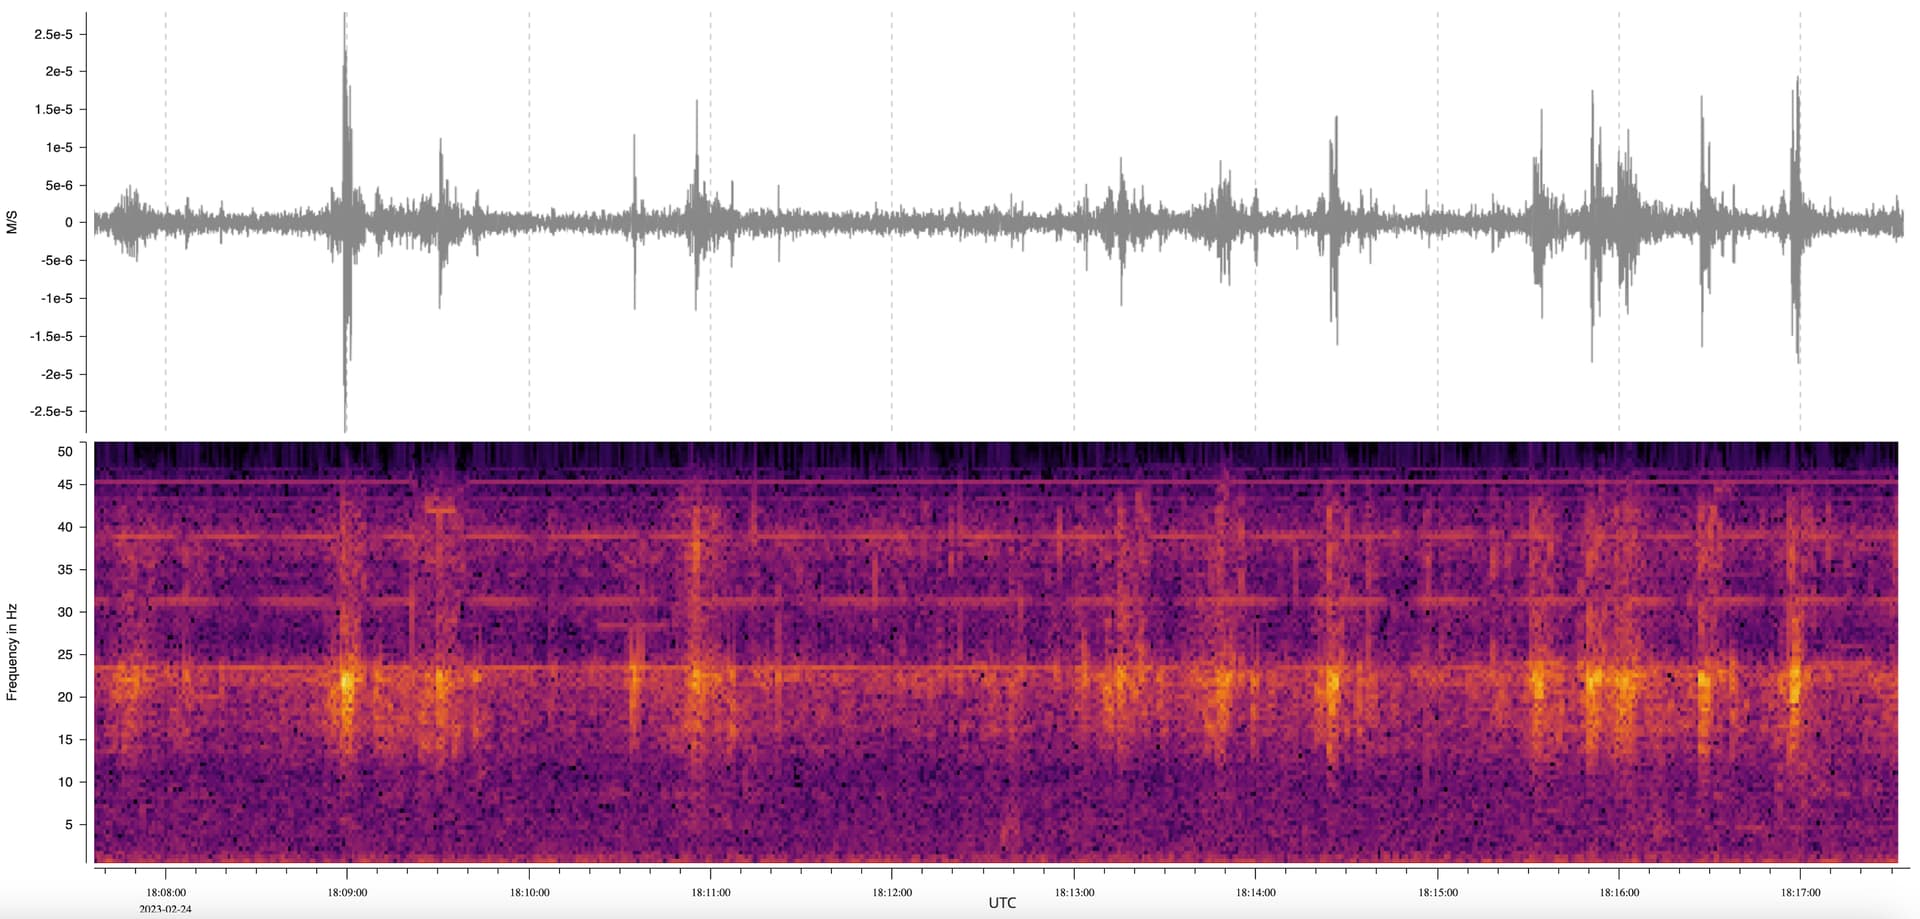
I want to produce a frequency plot and analysis the frequency content of my seismogram as below but I am not idea how to do that.
Or you could do it via PPSD and it’s plot spectrogram routine (bit of a different approach): obspy.signal.spectral_estimation.PPSD.plot_spectrogram — ObsPy 1.4.1.post0+393.g271569d37b.obspy.master documentation
Example plots with links to code in gallery for both: