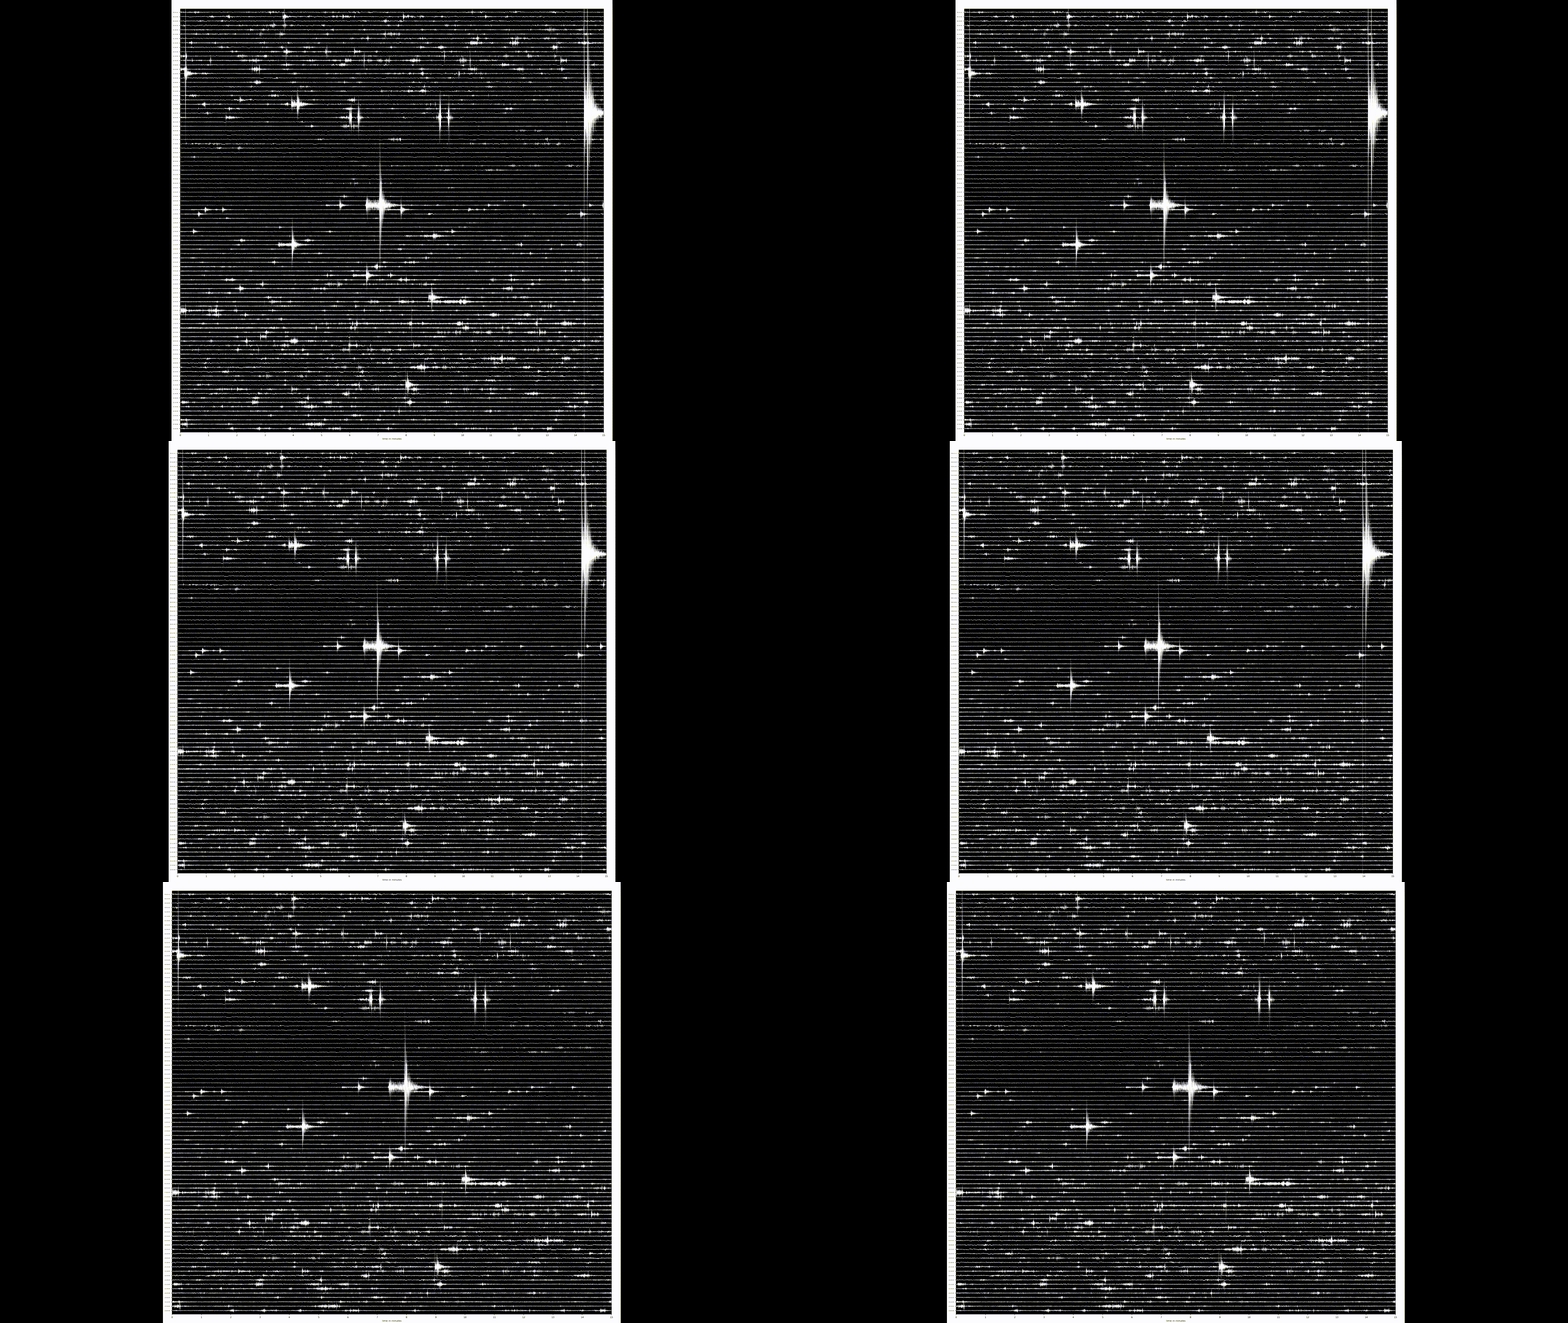
Hi everyone!
I’m trying to create a dayplot, but I’m running into an issue where the data on the right-hand side of the plot is being cut off. This only seems to happen with certain output sizes; e.g., starting at a resolution of 4000 x 4000 and then slowly increasing the width “reveals” data that has been cut off. Once the resolution reaches a certain width, however, the issue seems to get much worse, with the traces being “stretched” to the right, leading to several minutes of data being cut off.
The issue is hard to explain, so I’ll attach a gif of what’s happening. The first frame of the gif is a plot with the output size set to 4000 x 4000, the second frame is at 4050 x 4000, third frame at 4100 x 4000, then the fourth frame is at 4150 x 4000. Notice how increasing the width from 4000 to 4100 seems to “reveal” more data on the right-hand side, while the left-hand side remains the same. Once the width reaches 4150, the traces appear to become stretched out very far to the right. This leads to several minutes of data being cut off, and the time being innacurate

The issue seems to only be with the size parameter. Changing dpi, using different input data, etc doesn’t do anything. It only seems to be affected by the horizontal resolution too… changing the vertical size doesn’t do anything.
Here is the script I’m using:
#
#SCRIPT FOR 2024-05-27 DAYPLOT
#

from obspy import read
from obspy.core import UTCDateTime
from obspy.core import Stream

st = UTCDateTime("2024-05-27T00:00:00")
et = UTCDateTime("2024-05-27T23:59:59")

wf = read("*.sac")

wf.plot(type='dayplot', interval=15, right_vertical_labels=False,
        vertical_scaling_range=75, one_tick_per_line=True,
        color=['white'], linewidth=0.25, bgcolor='black', show_y_UTC_label=False,
        starttime=st, endtime=et,
        dpi=200, size=(4150,4000), y_labels_size=4,
        subplots_adjust_left=0.02, subplots_adjust_right=0.98, subplots_adjust_top=0.98, subplots_adjust_bottom=0.02)