Hello all,
I am trying to calculate the PPSD of my local seismic stations. But I have no idea how to organize the data or how long it should be.
My data is in sac format, with 1 hour for each component. almost 4 years, which makes it huge data.
Any advice on how to start? because I am confused.
Hi,
Please do not cross-post on github and here.
Please check out the ObsPy tutorial on PPSD.
You could also try to use CLI-tool obspy-ppsd.
You can analyze as much data as you want. I guess one month is enough for a start.
Hello,
Sorry to bother. I tried to work on the script that you sent but I did not know how to make it executable.
I wrote a script but it seems that i made a mistakes. Could you please check the script;
#!/usr/bin/env python

import os
from obspy import read, read_inventory
from obspy.signal import PPSD

# Set file paths
data_dir = "/home/muntadher/Downloads/PPSD/BSR2-BHZ/"
xml_dir = "/home/muntadher/Downloads/PPSD/BSR2-BHZ/"

# Loop through each file in data directory
for filename in os.listdir(data_dir):
    if filename.endswith(".sac"):
        print(f"Calculating PPSD for file {filename}...")
        # Read in data file
        st = read(os.path.join(data_dir, filename))
        # Read in XML station file
        inv = read_inventory(os.path.join(xml_dir, f"{st[0].stats.station}.xml"))
        # Initialize PPSD object
        ppsd = PPSD(st[0].stats, metadata=inv[0][0], db_bins=(-200, 20, 0.1))
        # Add each channel to PPSD object
        for tr in st:
            ppsd.add(tr)
        # Save PPSD to file
        ppsd.save(f"{filename}.ppsd", "PPSD (dB rel. 1 $(m/s^2)^2/Hz$)")
When I run the script it it gives me the error:
Calculating PPSD for file 20191025_2000z.sac…
Traceback (most recent call last):
File “PPSD”, line 18, in
inv = read_inventory(os.path.join(xml_dir, f"{st[0].stats.station}.xml"))
File “/home/muntadher/.local/lib/python3.8/site-packages/decorator.py”, line 232, in fun
return caller(func, *(extras + args), **kw)
File “/home/muntadher/.local/lib/python3.8/site-packages/obspy/core/util/decorator.py”, line 291, in _map_example_filename
return func(*args, **kwargs)
File “/home/muntadher/.local/lib/python3.8/site-packages/obspy/core/inventory/inventory.py”, line 91, in read_inventory
return _generic_reader(path_or_file_object, _read, format=format,
File “/home/muntadher/.local/lib/python3.8/site-packages/obspy/core/util/base.py”, line 655, in _generic_reader
raise IOError(2, “No such file or directory”, pathname)
FileNotFoundError: [Errno 2] No such file or directory: ‘/home/muntadher/Downloads/PPSD/BSR2-BHZ/WO2202.xml’
Could you please highlight the problem
Thanks in advance,
Hey,
you can make a scirpt executable with chmod in linux or just call it using python obspy-ppsd.
The problem with your script is FileNotFoundError ... PPSD/BSR2-BHZ/WO2202.xml. (Read Python tracebacks from bottom to top.) I suggest to read the full station inventory only once outside of the loop.
I modified the script, and it keeps not working.
Can I send you four days of data with the XML file to test it on your machine? or if you have a script could you please provide me with?
I will be grateful for that.
Sure, you can send me the data. One day is enough though.
I do not have a script. I use the CLI tool. You could modify the script from the tutorial linked above.
With the following lines you can calculate and plot PPSDs with obspy-ppsd. I have StationXML files in a RESPONSES folder and data files in a MSEED folder.
obspy-ppsd add -h -i "RESPONSES/*.xml" MSEED/*.mseed
You can change parameters passed to obspy, see obspy-ppsd add -h. E.g. if you want the PPSD to have more wiggles and different frequency limits instead use
obspy-ppsd add -h -i "RESPONSES/*.xml" MSEED/*.mseed --period-smoothing-width-octaves 0.125 --period-step-octaves 0.125 --period-limits "(0.01,100)"
The command created npz files with the PPSDs. You can plot these with the following command. It will create png files.
obspy-ppsd plot *.npz --cmap pqlx
To change the colormap use --cmap option, see obspy-ppsd plot -h.
That was really helpful.
I just plotted this figure
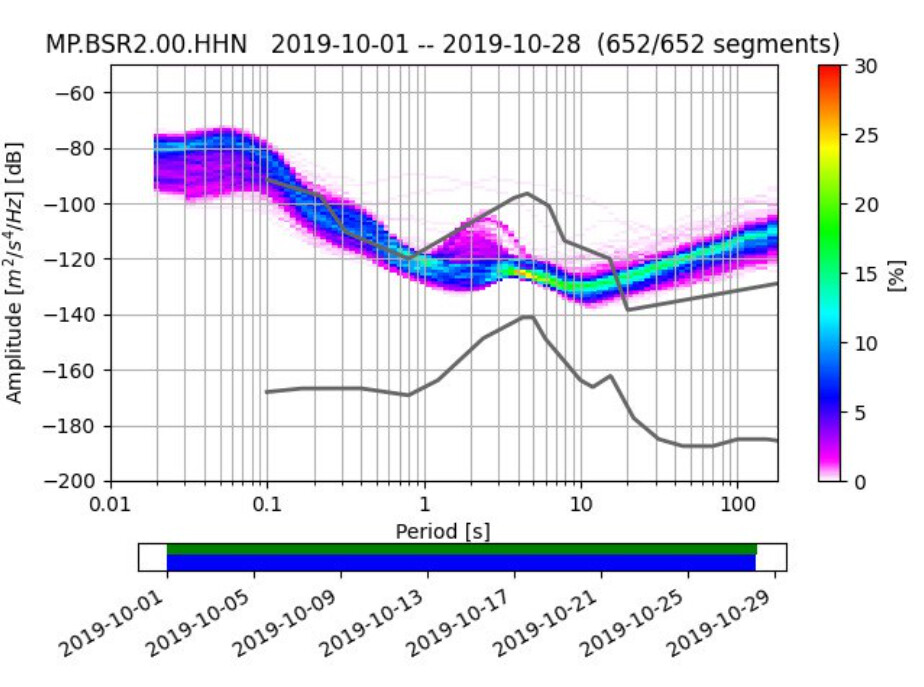
But I am confused. I used the same data and period in this figure but the result is different.
http://service.iris.edu/mustang/noise-pdf-browser/1/breakout?target=MP.BSR2.00.HHE.M&time=2019-10-01T00:00:00&interval=month&format=html
Is that the same type of figure? In my figure, I see an amplitude value, whereas the IRIS result shows a power value.
if you note the equation in the Y-axis label of the IRIS figure, it describes “power” as 10 log10 (amplitude). so, they are showing the same data**, it’s just scaled differently. for QC purposes it likely doesn’t matter as you’re probably just interested at the data relative to a background earth model.
**it looks like you are plotting HHN and the iris data in your link is HHE (that channel also looks like it is mostly white noise)
1 Like
How can I interpret these figures? any advice about that?
could you please tell me what is the explanation of the figure above?
You can see a short period instrument in a consistently very noisy location. But to be more serious, you should read the papers around the realease of PQLX, good reads, linked in our citations: Citations — ObsPy 1.4.2 documentation
And then there’s the open file report for PQLX which is also a good read: