Hello members of Obspy,
I am starting to studying seismic arrays, so I decided to implement an array response of my deployment of ocean botton seismometers.
I attach a map and the script I ve used to calculate the array response. So I would like to know if someone could check if it is everything all right.
Moreover I would like to know if you could give me a hand with the fully understanding of the capabilities of this array. Because, from the array response I don’t fully unsestand if this array will be able to detect earthquakes (local/regional or telesismics) , what kind of waves I will be able to manage implementing a F-K analysis or vespagram.
Another question is, this array reponse is just for k(vector from the north) how can I know how well would be my array for differents backazimuth N—>E.
Thank you so much for any help
SCRIPT
import numpy as np
import matplotlib.pyplot as plt
from obspy.imaging.cm import obspy_sequential
from obspy.signal.array_analysis import array_transff_wavenumber
generate array coordinates
coords = np.array([[-10.373608,35.909685, 0.021], [-10.554655,35.594688, 0.154], [-10.988262,35.595025,0.023],[-10.988500, 36.220166,0.204], [-10.555266,36.220216,0.003]])
#coords /= 1000.
klim = 0.5
kxmin = -klim
kxmax = klim
kymin = -klim
kymax = klim
kstep = klim / 100.
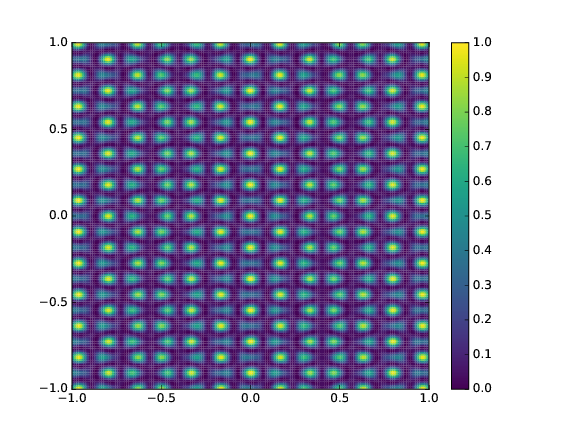
transff = array_transff_wavenumber(coords, klim, kstep, coordsys=‘lonlat’)
plot
plt.pcolor(np.arange(kxmin, kxmax + kstep * 1.1, kstep) - kstep / 2.,
np.arange(kymin, kymax + kstep * 1.1, kstep) - kstep / 2.,
transff.T, cmap=obspy_sequential)
plt.colorbar()
plt.clim(vmin=0., vmax=1.)
plt.xlim(kxmin, kxmax)
plt.ylim(kymin, kymax)
plt.show()
arrayresponse.py (838 Bytes)