# Y axis limits in PPSD plots
**URL:** https://discourse.obspy.org/t/y-axis-limits-in-ppsd-plots/885
**Category:** Users Mailing List Archive
**Tags:** archive
**Created:** [April 24, 2020, 5:02pm UTC](https://discourse.obspy.org/t/y-axis-limits-in-ppsd-plots/885 "2020-04-24T17:02:49Z")
**Posts on this page:** 5
**Page:** 1
### Author:  [@Robert\_Sohn](https://discourse.obspy.org/u/Robert_Sohn)
#### Post date: [April 24, 2020, 5:02pm UTC](https://discourse.obspy.org/t/y-axis-limits-in-ppsd-plots/885/1 "2020-04-24T17:02:49Z")
How can I change the default y-axis limits in PPSD.plot?
Thanks, Rob
---
### Author:  [@megies](https://discourse.obspy.org/u/megies)
#### Post date: [April 27, 2020, 9:08am UTC](https://discourse.obspy.org/t/y-axis-limits-in-ppsd-plots/885/2 "2020-04-27T09:08:12Z")
Use show=False, don't use filename=... and then work with the returned
matplotlib Figure object and call pyplot show when done or save to file.
Something like
fig = ppsd.plot(...)
fig.axes[0].set\_ylim(..., ...)
cheers,
Tobias
---
### Author:  [@Robert\_Sohn](https://discourse.obspy.org/u/Robert_Sohn)
#### Post date: [April 27, 2020, 1:54pm UTC](https://discourse.obspy.org/t/y-axis-limits-in-ppsd-plots/885/3 "2020-04-27T13:54:23Z")
Thanks for the help. It's not quite working, though...
I use the following code:
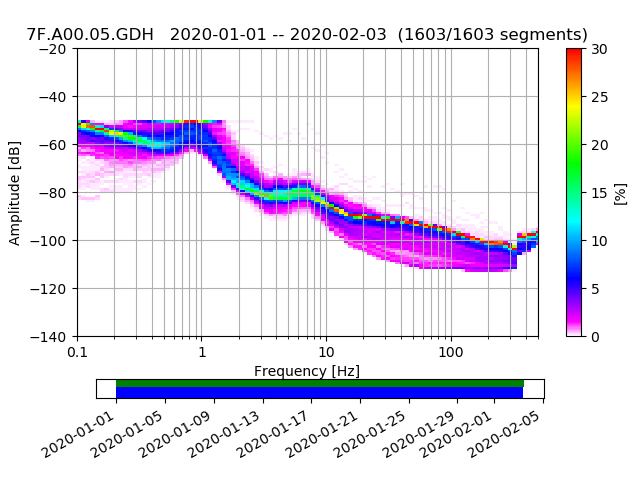
fig = ppsd.plot(show=False,xaxis\_frequency=True,period\_lim=(0.002, 10),cmap=pqlx,show\_noise\_models=False)
fig.axes[0].set\_ylim(-140, -20)
And get, for example, the attached figure. Although I can change the upper y-axis limit to -20, the plot doesn't show anything above -50, which is the upper y-axis limit in the default settings, even though there is signal up there. Note that I am plotting hydrophone data, which is why the dB levels are not aligned with 'normal' seismometer data.
Does this have something to do with db\_bin\_edges setting in the ppsd routine?
Thanks, Rob
Quoting Tobias Megies \:
---
### Author:  [@megies](https://discourse.obspy.org/u/megies)
#### Post date: [April 29, 2020, 8:26am UTC](https://discourse.obspy.org/t/y-axis-limits-in-ppsd-plots/885/4 "2020-04-29T08:26:00Z")
So you do not want the plot limits to change, but the processing
parameters. You need to specify that when initializing your PPSD before
feeding in data:
[http://docs.obspy.org/master/packages/autogen/obspy.signal.spectral\_estimation.PPSD.\_\_init\_\_.html?highlight=db\_bins](http://docs.obspy.org/master/packages/autogen/obspy.signal.spectral_estimation.PPSD. __init__.html?highlight=db_bins)
ppsd = PPSD(..., db\_bins=...)
best,
Tobias
---
### Author:  [@Robert\_Sohn](https://discourse.obspy.org/u/Robert_Sohn)
#### Post date: [April 29, 2020, 11:54am UTC](https://discourse.obspy.org/t/y-axis-limits-in-ppsd-plots/885/5 "2020-04-29T11:54:45Z")
Thanks. I now see it has to be done by setting the db\_bins parameter.
Best, Rob
Quoting Tobias Megies \: