# Time vs. slowness
**URL:** https://discourse.obspy.org/t/time-vs-slowness/1556
**Category:** Related: rf
**Created:** [November 17, 2022, 11:37am UTC](https://discourse.obspy.org/t/time-vs-slowness/1556 "2022-11-17T11:37:18Z")
**Posts on this page:** 2
**Page:** 1
### Author:  [@Qian](https://discourse.obspy.org/u/Qian)
#### Post date: [November 17, 2022, 11:37am UTC](https://discourse.obspy.org/t/time-vs-slowness/1556/1 "2022-11-17T11:37:18Z")
Hi Mr. Tom Richter.
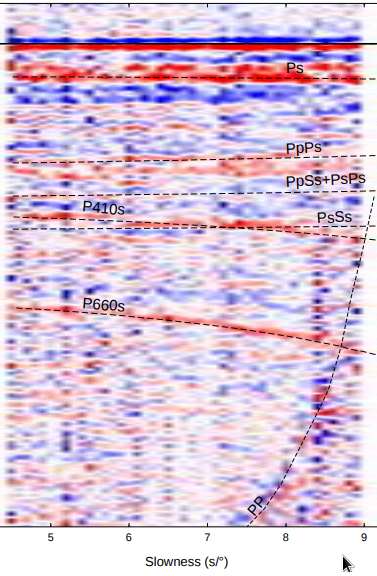
I am working with your scripts to generate stacks of RF. I want to generate a stacked section, but instead of time vs. distance, I want to plot time vs. slowness (as in the figure). Do you thing that it could be done using: get\_profile\_boxes(latlon, 0, slowness, width=400)?
Do you think it is feasible to do PRF and SRF with short period instruments?
Cheers!
---
### Author:  [@trichter](https://discourse.obspy.org/u/trichter)
#### Post date: [November 18, 2022, 1:17pm UTC](https://discourse.obspy.org/t/time-vs-slowness/1556/2 "2022-11-18T13:17:23Z")
Hi,
unfortunately no. It is not possible to plot out of the box a profile versus slowness instead of distance. Your picture also shows a migrated section. A migration code is not yet included in the package.
What is the corner frequency/period of your instruments? I think a corner period above 1s might be OK.
Best