# How to Plotting Waveforms Relative to Earthquake Origin Time?
**URL:** https://discourse.obspy.org/t/how-to-plotting-waveforms-relative-to-earthquake-origin-time/1964
**Category:** Usage Questions
**Created:** [June 14, 2024, 8:35am UTC](https://discourse.obspy.org/t/how-to-plotting-waveforms-relative-to-earthquake-origin-time/1964 "2024-06-14T08:35:41Z")
**Posts on this page:** 3
**Page:** 1
### Author:  [@moly](https://discourse.obspy.org/u/moly)
#### Post date: [June 14, 2024, 8:35am UTC](https://discourse.obspy.org/t/how-to-plotting-waveforms-relative-to-earthquake-origin-time/1964/1 "2024-06-14T08:35:41Z")
Hello everyone,
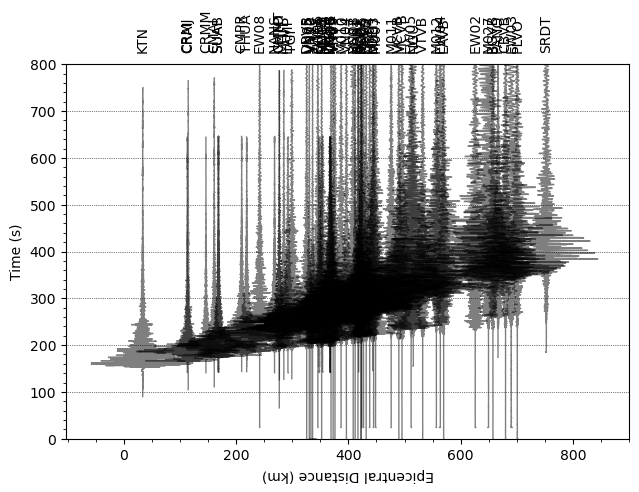
I am trying to plot waveforms from different stations with respect to their epicentral distance. Currently, my plot starts at the waveform’s start time, but I would like the waveforms to start at the earthquake’s origin time. How can I modify my code to achieve this?
Here is my current code:
from obspy import read, Stream
import glob
import matplotlib.pyplot as plt
from matplotlib.transforms import blended\_transform\_factory
all\_z\_data = glob.glob(“_H?Z_.SAC”)
stream = Stream()
for trdata in all\_z\_data:
tr = read(trdata)
#tr[0].detrend(“spline”, order=3, dspline=500)
#tr[0].filter(“bandpass”, freqmin = 1/40, freqmax = 1/5, corners=1, zerophase=True)
tr[0].stats[‘distance’] = tr[0].stats.sac.dist\*1000
stream +=tr[0]
stream.plot(outfile=‘recordSection1.png’,type=‘section’,offset\_max=900\*1000, scale=15, orientation=‘horizontal’, linewidth=0.8)
# Adjust y-axis limit
plt.xlim(-20, 500) # Set y-axis limit from 0 to 800 km
# Set axis labels
plt.ylabel(‘Epicentral Distance (km)’)
plt.xlabel(‘Time (s)’)
# Show the plot
plt.show()
---
### Author:  [@megies](https://discourse.obspy.org/u/megies)
#### Post date: [June 14, 2024, 9:56am UTC](https://discourse.obspy.org/t/how-to-plotting-waveforms-relative-to-earthquake-origin-time/1964/2 "2024-06-14T09:56:20Z")
Check the docs for `Stream.plot()`. It’s quite long but if you scroll down there is a part `Section parameters` and you can see `reftime` being mentioned there.
Also, please have a look at the pinned “Read this first” post for formatting (the python code blocks).
> **[obspy.core.stream.Stream.plot — ObsPy...](https://docs.obspy.org/master/packages/autogen/obspy.core.stream.Stream.plot.html#obspy.core.stream.Stream.plot)**
---
### Author:  [@moly](https://discourse.obspy.org/u/moly)
#### Post date: [June 17, 2024, 3:37am UTC](https://discourse.obspy.org/t/how-to-plotting-waveforms-relative-to-earthquake-origin-time/1964/3 "2024-06-17T03:37:30Z")
Thanks Megies, It is really helpful for me.